Для эффективного управления веб-сервером необходимо получить обратную связь об активности и производительности сервера, а также о всех проблемах, которые могли случиться. Apache HTTP Server обеспечивает очень полную и гибкую возможность ведения журнала. В этой статье мы разберём, как настроить логи Apache и как понимать, что они содержат.
HTTP-сервер Apache предоставляет множество различных механизмов для регистрации всего, что происходит на вашем сервере, от первоначального запроса до процесса сопоставления URL-адресов, до окончательного разрешения соединения, включая любые ошибки, которые могли возникнуть в процессе. В дополнение к этому сторонние модули могут предоставлять возможности ведения журналов или вставлять записи в существующие файлы журналов, а приложения, такие как программы CGI, сценарии PHP или другие обработчики, могут отправлять сообщения в журнал ошибок сервера.
В этой статье мы рассмотрим модули журналирования, которые являются стандартной частью http сервера.
Логи Apache в Windows
В Windows имеются особенности настройки имени файла журнала — точнее говоря, пути до файла журнала. Если имена файлов указываются с начальной буквы диска, например «C:/«, то сервер будет использовать явно указанный путь. Если имена файлов НЕ начинаются с буквы диска, то к указанному значению добавляется значение ServerRoot — то есть «logs/access.log» с ServerRoot установленной на «c:/Server/bin/Apache24″, будет интерпретироваться как «c:/Server/bin/Apache24/logs/access.log«, в то время как «c:/logs/access.log» будет интерпретироваться как «c:/logs/access.log«.
Также особенностью указания пути до логов в Windows является то, что нужно использовать слэши, а не обратные слэши, то есть «c:/apache» вместо «c:apache«. Если пропущена буква диска, то по умолчанию будет использоваться диск, на котором размещён httpd.exe. Рекомендуется явно указывать букву диска при абсолютных путях, чтобы избежать недоразумений.
Apache error: ошибки сервера и сайтов
Путь до файла журнала с ошибками указывается с помощью ErrorLog, например, для сохранения ошибок в папке «logs/error.log» относительно корневой папки веб-сервера:
ErrorLog "logs/error.log"
Если не указать директиву ErrorLog внутри контейнера <VirtualHost>, сообщения об ошибках, относящиеся к этому виртуальному хосту, будут записаны в этот общий файл. Если в контейнере <VirtualHost> вы указали путь до файла журнала с ошибками, то сообщения об ошибках этого хоста будут записываться там, а не в этот файл.
С помощью директивы LogLevel можно установить уровень важности сообщений, которые должны попадать в журнал ошибок. Доступные варианты:
- debug
- info
- notice
- warn
- error
- crit
- alert
- emerg
Журнал ошибок сервера, имя и местоположение которого задаётся директивой ErrorLog, является наиболее важным файлом журнала. Это место, куда Apache httpd будет отправлять диагностическую информацию и записывать любые ошибки, с которыми он сталкивается при обработке запросов. Это первое место, где нужно посмотреть, когда возникает проблема с запуском сервера или работой сервера, поскольку он часто содержит подробности о том, что пошло не так и как это исправить.
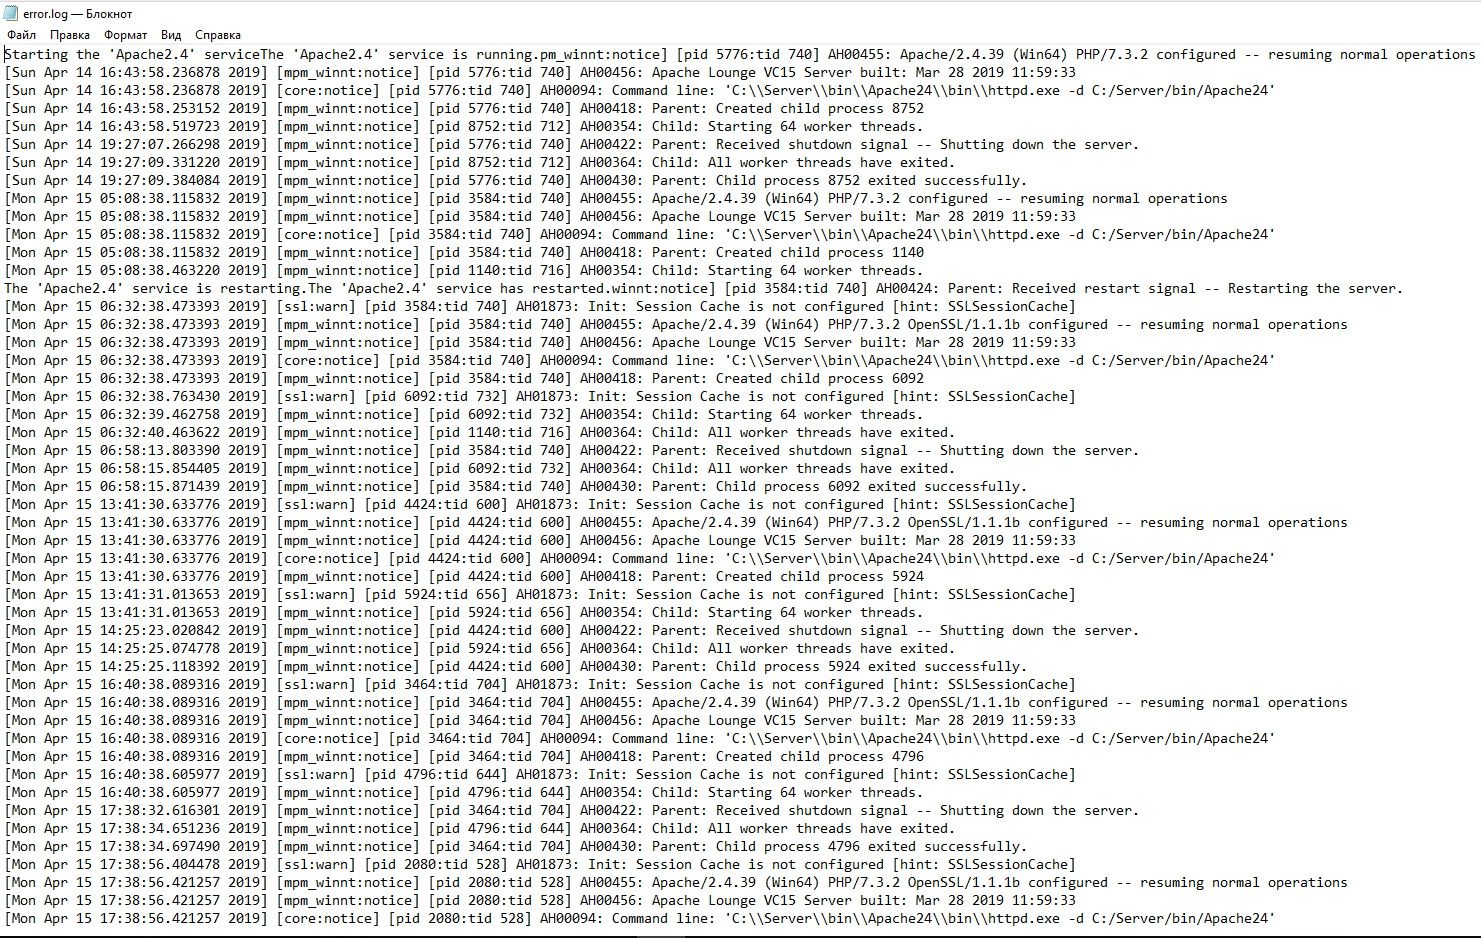
Журнал ошибок обычно записывается в файл (обычно это error_log в системах Unix и error.log в Windows и OS/2). В системах Unix также возможно, чтобы сервер отправлял ошибки в системный журнал или передавал их программе.
Формат журнала ошибок определяется директивой ErrorLogFormat, с помощью которой вы можете настроить, какие значения записываются в журнал. По умолчанию задан формат, если вы его не указали. Типичное сообщение журнала следующее:
[Fri Sep 09 10:42:29.902022 2011] [core:error] [pid 35708:tid 4328636416] [client 72.15.99.187] File does not exist: /usr/local/apache2/htdocs/favicon.ico
Первый элемент в записи журнала — это дата и время сообщения. Следующим является модуль, создающий сообщение (в данном случае ядро) и уровень серьёзности этого сообщения. За этим следует идентификатор процесса и, если необходимо, идентификатор потока процесса, в котором возникло условие. Далее у нас есть адрес клиента, который сделал запрос. И, наконец, подробное сообщение об ошибке, которое в этом случае указывает на запрос о несуществующем файле.
В журнале ошибок может появиться очень большое количество различных сообщений. Большинство выглядит похожим на пример выше. Журнал ошибок также будет содержать отладочную информацию из сценариев CGI. Любая информация, записанная в stderr (стандартный вывод ошибок) сценарием CGI, будет скопирована непосредственно в журнал ошибок.
Если поместить токен %L в журнал ошибок и журнал доступа, будет создан идентификатор записи журнала, с которым вы можете сопоставить запись в журнале ошибок с записью в журнале доступа. Если загружен mod_unique_id, его уникальный идентификатор запроса также будет использоваться в качестве идентификатора записи журнала.
Во время тестирования часто бывает полезно постоянно отслеживать журнал ошибок на наличие проблем. В системах Unix вы можете сделать это, используя:
tail -f error_log
Apache access: логи доступа к серверу
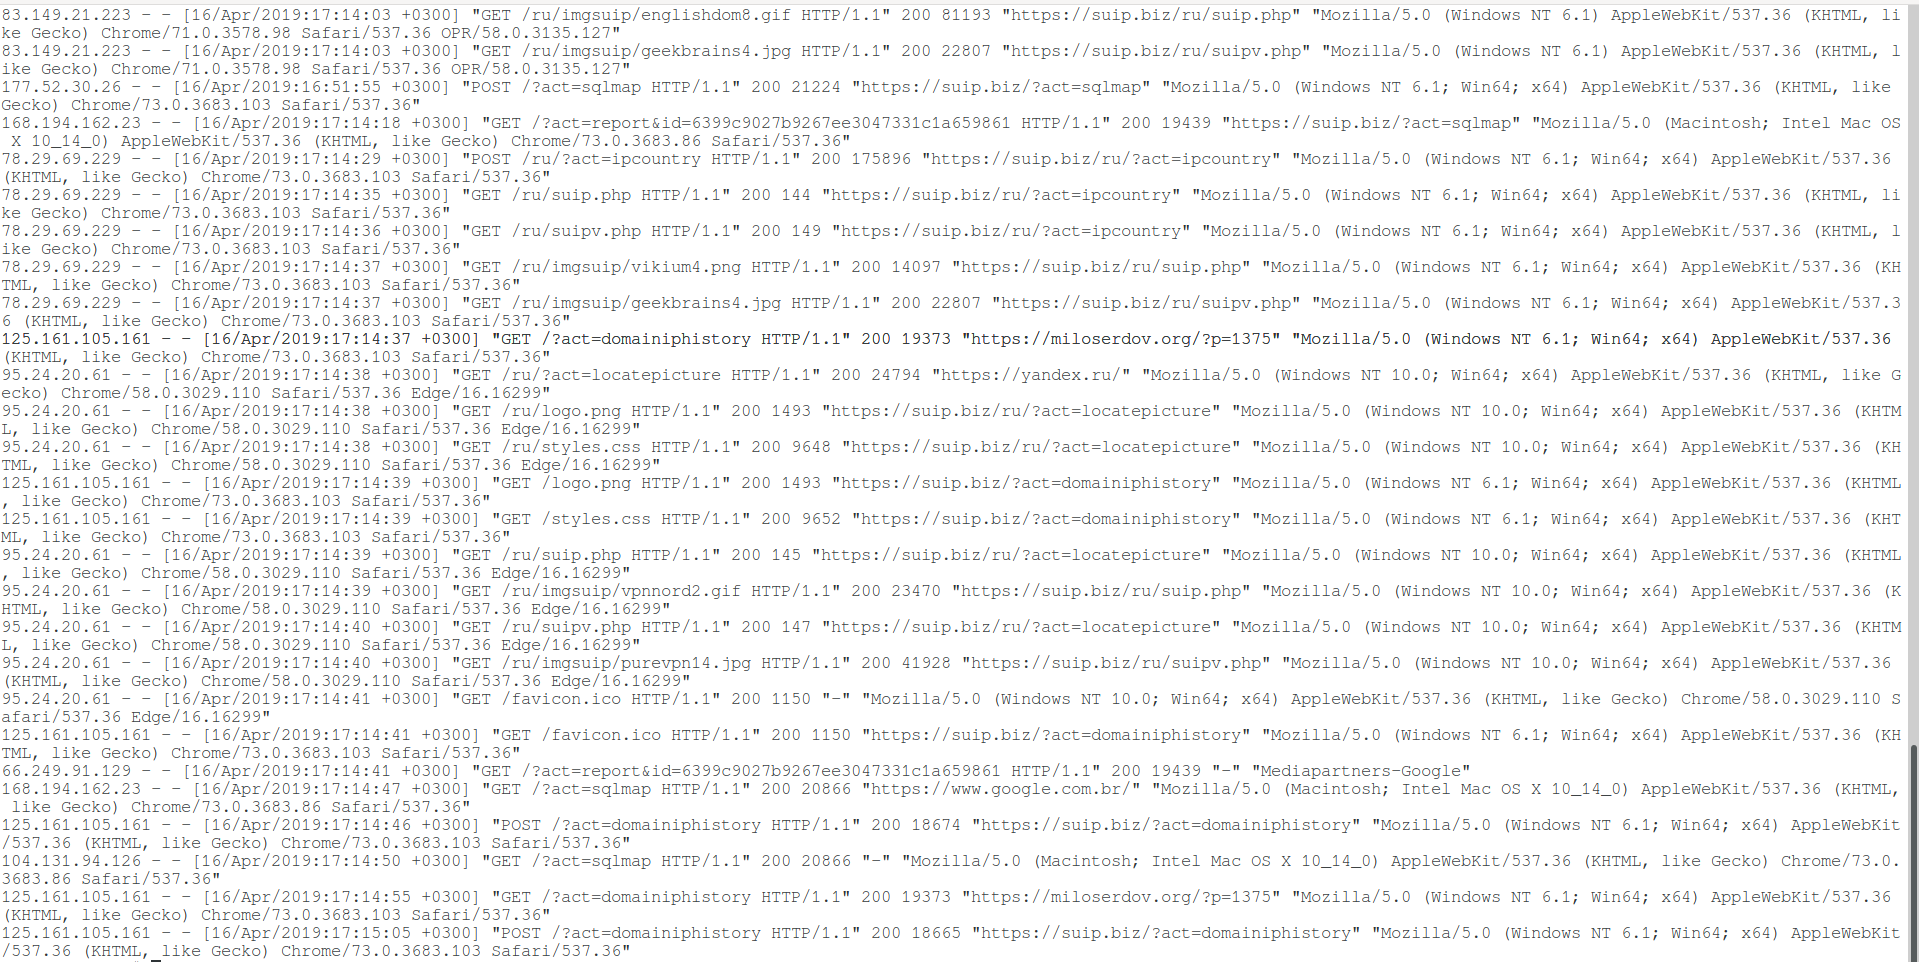
Журнал доступа к серверу записывает все запросы, обработанные сервером. Расположение и содержимое журнала доступа контролируются директивой CustomLog. Директива LogFormat может быть использована для упрощения выбора содержимого журналов. В этом разделе описывается, как настроить сервер для записи информации в журнал доступа.
Различные версии Apache httpd использовали разные модули и директивы для управления журналом доступа, включая mod_log_referer, mod_log_agent и директиву TransferLog. Директива CustomLog теперь включает в себя функциональность всех старых директив.
Формат журнала доступа легко настраивается. Формат указывается с использованием строки формата, которая очень похожа на строку формата printf в стиле C. Некоторые примеры представлены в следующих разделах. Полный список возможного содержимого строки формата смотрите здесь: https://httpd.apache.org/docs/current/mod/mod_log_config.html
Общий формат журнала (Common Log)
Типичная конфигурация для журнала доступа может выглядеть следующим образом.
LogFormat "%h %l %u %t "%r" %>s %b" common
CustomLog logs/access_log common
В первой строке задано имя (псевдоним) common, которому присвоено в качестве значения строка «%h %l %u %t «%r» %>s %b«.
Строка формата состоит из директив, начинающихся с символа процента, каждая из которых указывает серверу регистрировать определённый фрагмент информации. Литеральные (буквальные) символы также могут быть помещены в строку формата и будут скопированы непосредственно в вывод журнала. Символ кавычки («) должен быть экранирован путём размещения обратной косой черты перед ним, чтобы он не интерпретировался как конец строки формата. Строка формата также может содержать специальные управляющие символы «n«для новой строки и «t» для обозначения таба (табуляции).
В данной строке значение директив следующее:
- %h — имя удалённого хоста. Будет записан IP адрес, если HostnameLookups установлен на Off, что является значением по умолчанию.
- %l — длинное имя удалённого хоста (от identd, если предоставит). Это вернёт прочерк если не присутствует mod_ident и IdentityCheck не установлен на On.
- %u — удалённый пользователь, если запрос был сделан аутентифицированным пользователем. Может быть фальшивым, если возвращён статус (%s) 401 (unauthorized).
- %t — время получения запроса в формате [18/Sep/2011:19:18:28 -0400]. Последнее показывает сдвиг временной зоны от GMT
- «%r» — первая строка запроса, помещённая в буквальные кавычки
- %>s — финальный статус. Если бы было обозначение %s, то означало бы просто статус — для запросов, которые были внутренне перенаправлены это обозначало бы исходный статус.
- %b — размер ответа в байтах, исключая HTTP заголовки. В формате CLF, то есть ‘—‘ вместо 0, когда байты не отправлены.
Директива CustomLog устанавливает новый файл журнала, используя определённый псевдоним. Имя файла для журнала доступа относительно ServerRoot, если оно не начинается с косой черты (буквы диска).
Приведённая выше конфигурация будет сохранять записи журнала в формате, известном как Common Log Format (CLF). Этот стандартный формат может создаваться многими различными веб-серверами и считываться многими программами анализа журналов. Записи файла журнала, созданные в CLF, будут выглядеть примерно так:
127.0.0.1 - frank [10/Oct/2000:13:55:36 -0700] "GET /apache_pb.gif HTTP/1.0" 200 2326
Каждая часть этой записи журнала описана ниже.
127.0.0.1 (%h)
Это IP-адрес клиента (удалённого хоста), который сделал запрос к серверу. Если для HostnameLookups установлено значение On, сервер попытается определить имя хоста и зарегистрировать его вместо IP-адреса. Однако такая конфигурация не рекомендуется, поскольку она может значительно замедлить работу сервера. Вместо этого лучше всего использовать постпроцессор журнала, такой как logresolve, для определения имён хостов. Указанный здесь IP-адрес не обязательно является адресом машины, на которой сидит пользователь. Если между пользователем и сервером существует прокси-сервер, этот адрес будет адресом прокси, а не исходной машины.
— (%l)
«Дефис» в выходных данных указывает на то, что запрошенная часть информации недоступна. В этом случае информация, которая недоступна, является идентификационной информацией клиента RFC 1413, определённой с помощью id на клиентском компьютере. Эта информация крайне ненадёжна и почти никогда не должна использоваться, кроме как в жёстко контролируемых внутренних сетях. Apache httpd даже не будет пытаться определить эту информацию, если для IdentityCheck не установлено значение On.
frank (%u)
Это идентификатор пользователя, запрашивающего документ, как определено HTTP-аутентификацией. Такое же значение обычно предоставляется сценариям CGI в переменной среды REMOTE_USER. Если код состояния для запроса равен 401, то этому значению не следует доверять, поскольку пользователь ещё не аутентифицирован. Если документ не защищён паролем, эта часть будет «—«, как и предыдущая.
[10/Oct/2000:13:55:36 -0700] (%t)
Время получения запроса. Формат такой:
[день/месяц/год:час:минута:секунда зона]
день = 2*цифры
месяц = 3*цифры
год = 4*цифры
час = 2*цифры
минута = 2*цифры
секунда = 2*цифры
зона = (`+’ | `-‘) 4*цифры
Можно отобразить время в другом формате, указав %{format}t в строке формата журнала, где формат такой же, как в strftime(3) из стандартной библиотеки C, или один из поддерживаемых специальных токенов. Подробности смотрите в строках формате строки mod_log_config.
«GET /apache_pb.gif HTTP/1.0» («%r»)
Строка запроса от клиента указана в двойных кавычках. Строка запроса содержит много полезной информации. Во-первых, клиент использует метод GET. Во-вторых, клиент запросил ресурс /apache_pb.gif, и в-третьих, клиент использовал протокол HTTP/1.0. Также возможно зарегистрировать одну или несколько частей строки запроса независимо. Например, строка формата «%m %U%q %H» будет регистрировать метод, путь, строку запроса и протокол, что приведёт к тому же результату, что и «%r«.
200 (%>s)
Это код состояния, который сервер отправляет обратно клиенту. Эта информация очень ценна, потому что она показывает, привёл ли запрос к успешному ответу (коды начинаются с 2), к перенаправлению (коды начинаются с 3), к ошибке, вызванной клиентом (коды начинаются с 4), или к ошибкам в сервер (коды начинаются с 5). Полный список возможных кодов состояния можно найти в спецификации HTTP (RFC2616 раздел 10).
2326 (%b)
Последняя часть указывает размер объекта, возвращаемого клиенту, не включая заголовки ответа. Если контент не был возвращён клиенту, это значение будет «—«. Чтобы записать «0» без содержимого, вместо %b используйте %B.
Логи комбинированного формата (Combined Log)
Другая часто используемая строка формата называется Combined Log Format. Может использоваться следующим образом.
LogFormat "%h %l %u %t "%r" %>s %b "%{Referer}i" "%{User-agent}i"" combined
CustomLog log/access_log combined
Этот формат точно такой же, как Common Log Format, с добавлением ещё двух полей. Каждое из дополнительных полей использует директиву начинающуюся с символа процента %{заголовок}i, где заголовок может быть любым заголовком HTTP-запроса. Журнал доступа в этом формате будет выглядеть так:
127.0.0.1 - frank [10/Oct/2000:13:55:36 -0700] "GET /apache_pb.gif HTTP/1.0" 200 2326 "http://www.example.com/start.html" "Mozilla/4.08 [en] (Win98; I ;Nav)"
Дополнительными полями являются:
«http://www.example.com/start.html» («%{Referer}i»)
Referer — это часть заголовок HTTP-запроса, которая называется также Referer. В этой строке содержится информация о странице, с которой клиент был прислан на данный сайт. (Это должна быть страница, которая ссылается или включает /apache_pb.gif).
«Mozilla/4.08 [en] (Win98; I ;Nav)» («%{User-agent}i»)
Заголовок HTTP-запроса User-Agent. Это идентифицирующая информация, которую клиентский браузер сообщает о себе.
По умолчанию в главном конфигурационном файле Apache прописаны следующие настройки логов:
<IfModule log_config_module>
    LogFormat "%h %l %u %t "%r" %>s %b "%{Referer}i" "%{User-Agent}i"" combined
    LogFormat "%h %l %u %t "%r" %>s %b" common

    <IfModule logio_module>
      LogFormat "%h %l %u %t "%r" %>s %b "%{Referer}i" "%{User-Agent}i" %I %O" combinedio
    </IfModule>

    CustomLog "logs/access.log" common
</IfModule>
Как можно увидеть, установлены три псевдонима: combined, common и combinedio. При этом по умолчанию используется common. При желании вы без труда сможете переключиться на combined или настроить формат строки лога под свой вкус.
Например, если вы предпочитаете, чтобы в файле лога доступа также присутствовала информация о пользовательском агенте и реферере, то есть Combined Logfile Format, то вы можете использовать следующую директиву:
CustomLog "logs/access.log" combined
Связанные статьи:
- Почему в логах ошибок Apache не сохраняются записи об ошибке 404 (100%)
- Как в Apache под Windows настроить автоматическую ротацию и очистку логов (100%)
- Удалённый просмотр и поиск по логам Apache в Windows (модуль mod_view) (100%)
- Apache для Windows (54.5%)
- Как запустить Apache на Windows (54.5%)
- Как обновить MySQL (RANDOM — 50%)
At the time of writing, the Apache HTTP server is
used by 30.8% of all web
servers in operation. If you’re responsible for managing any system that
utilizes Apache, then you will surely interact with its logging infrastructure
on a regular basis. This tutorial will introduce you to logging in Apache and
how it can help you diagnose, troubleshoot, and quickly resolve any problem you
may encounter on your server.
You will learn where logs are stored, how to access them, and how to customize
the log output and location to fit your needs. You will also learn how to
centralize Apache logs in a log management system for easier tracing, searching,
and filtering of logs across your entire stack.
🔭 Want to centralize and monitor your Apache logs?
Head over to Logtail and start ingesting your logs in 5 minutes.
Prerequisites
To follow through with this tutorial, you should set up a Linux server that
includes a non-root user with sudo privileges. Additionally, you also need the
Apache HTTP server installed and enabled on the server, which can be done by
executing the relevant commands below.
On Debian-based distributions like Ubuntu:
sudo systemctl enable apache2
sudo systemctl start apache2
On RHEL, Fedora or CentOS:
sudo systemctl enable httpd
sudo systemctl start httpd
Please note that the rest of the commands, directory configurations, and
conventions used in this tutorial pertain to Debian-based distributions like
Ubuntu. Still, the concepts remain the same for other distributions.
Step 1 — Getting started with Apache logging
Apache logs are files that record everything the Apache web server is doing for
later analysis by the server administrator. The records of all Apache events are
placed in two different text files:
- Access Log: this file stores information about incoming requests. You’ll
find details about each request such as the requested resource, response
codes, time taken to generate the response, IP address of the client, and
more. - Error Log: this file contains diagnostic information about any errors were
encountered while processing requests.
Step 2 — Locating the Apache log files
The log files’ location depends on the operating system the Apache web server is
running. On Debian-based operating systems like Ubuntu, the access log file is
located in /var/log/apache2/access.log. On CentOS, RHEL, or Fedora, the access
log file is stored in /var/log/httpd/access_log.
A typical access log entry might look like this:
::1 - - [13/Nov/2020:11:32:22 +0100] "GET / HTTP/1.1" 200 327 "-" "Mozilla/5.0 (Windows NT 10.0; Win64; x64) AppleWebKit/537.36 (KHTML, like Gecko) Chrome/86.0.4240.198 Safari/537.36"
Similarly, the error log file is located in /var/log/apache2/error.log on
Debian-based systems and /var/log/httpd/error_log on CentOS, RHEL, or Fedora.
A typical error log entry might look like this:
[Thu May 06 12:03:28.470305 2021] [php7:error] [pid 731] [client ::1:51092] script '/var/www/html/missing.php' not found or unable to stat
In the next section, we’ll discuss how to view these log files from the command
line.
Step 3 — Viewing Apache Log files
One of the most common ways to view an Apache log file is through the tail
command which prints the last 10 lines from a file. When the -f option is
supplied, the command will watch the file and output its contents in real-time.
sudo tail -f /var/log/apache2/access.log
You should observe the following output on the screen:
. . .

198.54.132.137 - - [04/Feb/2022:11:34:04 +0000] "GET / HTTP/1.1" 200 3477 "-" "Mozilla/5.0 (Windows NT 10.0; Win64; x64) AppleWebKit/537.36 (KHTML, like Gecko) Chrome/97.0.4692.99 Safari/537.36"
198.54.132.137 - - [04/Feb/2022:11:34:04 +0000] "GET / HTTP/1.1" 200 3477 "-" "Mozilla/5.0 (Windows NT 10.0; Win64; x64) AppleWebKit/537.36 (KHTML, like Gecko) Chrome/97.0.4692.99 Safari/537.36"
198.54.132.137 - - [04/Feb/2022:11:34:04 +0000] "GET / HTTP/1.1" 200 3477 "-" "Mozilla/5.0 (Windows NT 10.0; Win64; x64) AppleWebKit/537.36 (KHTML, like Gecko) Chrome/97.0.4692.99 Safari/537.36"
198.54.132.137 - - [04/Feb/2022:11:34:05 +0000] "GET / HTTP/1.1" 200 3476 "-" "Mozilla/5.0 (Windows NT 10.0; Win64; x64) AppleWebKit/537.36 (KHTML, like Gecko) Chrome/97.0.4692.99 Safari/537.36"
198.54.132.137 - - [04/Feb/2022:11:34:06 +0000] "GET / HTTP/1.1" 200 3476 "-" "Mozilla/5.0 (Windows NT 10.0; Win64; x64) AppleWebKit/537.36 (KHTML, like Gecko) Chrome/97.0.4692.99 Safari/537.36"
198.54.132.137 - - [04/Feb/2022:11:34:06 +0000] "GET / HTTP/1.1" 200 3476 "-" "Mozilla/5.0 (Windows NT 10.0; Win64; x64) AppleWebKit/537.36 (KHTML, like Gecko) Chrome/97.0.4692.99 Safari/537.36"
198.54.132.137 - - [04/Feb/2022:11:34:07 +0000] "GET / HTTP/1.1" 200 3476 "-" "Mozilla/5.0 (Windows NT 10.0; Win64; x64) AppleWebKit/537.36 (KHTML, like Gecko) Chrome/97.0.4692.99 Safari/537.36"
198.54.132.137 - - [04/Feb/2022:11:34:07 +0000] "GET / HTTP/1.1" 200 3476 "-" "Mozilla/5.0 (Windows NT 10.0; Win64; x64) AppleWebKit/537.36 (KHTML, like Gecko) Chrome/97.0.4692.99 Safari/537.36"
To view the entire contents of the file, you can use the cat command or open
the file in a text editor like nano or vim:
cat /var/log/apache2/access.log
You may also want to filter the log entries in the log file by a specific term.
In such cases, you should use the grep command. The first argument to grep
is the term you want to search for, while the second is the log file that will
be searched. In example below, we are filtering all the lines that contain the
word GET:
sudo grep GET /var/log/apache2/access.log
This should present the following output:
. . .

198.54.132.137 - - [04/Feb/2022:11:34:04 +0000] "GET / HTTP/1.1" 200 3477 "-" "Mozilla/5.0 (Windows NT 10.0; Win64; x64) AppleWebKit/537.36 (KHTML, like Gecko) Chrome/97.0.4692.99 Safari/537.36"
198.54.132.137 - - [04/Feb/2022:11:34:04 +0000] "GET / HTTP/1.1" 200 3477 "-" "Mozilla/5.0 (Windows NT 10.0; Win64; x64) AppleWebKit/537.36 (KHTML, like Gecko) Chrome/97.0.4692.99 Safari/537.36"
198.54.132.137 - - [04/Feb/2022:11:34:05 +0000] "GET / HTTP/1.1" 200 3476 "-" "Mozilla/5.0 (Windows NT 10.0; Win64; x64) AppleWebKit/537.36 (KHTML, like Gecko) Chrome/97.0.4692.99 Safari/537.36"
198.54.132.137 - - [04/Feb/2022:11:34:06 +0000] "GET / HTTP/1.1" 200 3476 "-" "Mozilla/5.0 (Windows NT 10.0; Win64; x64) AppleWebKit/537.36 (KHTML, like Gecko) Chrome/97.0.4692.99 Safari/537.36"
198.54.132.137 - - [04/Feb/2022:11:34:06 +0000] "GET / HTTP/1.1" 200 3476 "-" "Mozilla/5.0 (Windows NT 10.0; Win64; x64) AppleWebKit/537.36 (KHTML, like Gecko) Chrome/97.0.4692.99 Safari/537.36"
198.54.132.137 - - [04/Feb/2022:11:34:07 +0000] "GET / HTTP/1.1" 200 3476 "-" "Mozilla/5.0 (Windows NT 10.0; Win64; x64) AppleWebKit/537.36 (KHTML, like Gecko) Chrome/97.0.4692.99 Safari/537.36"
198.54.132.137 - - [04/Feb/2022:11:34:07 +0000] "GET / HTTP/1.1" 200 3476 "-" "Mozilla/5.0 (Windows NT 10.0; Win64; x64) AppleWebKit/537.36 (KHTML, like Gecko) Chrome/97.0.4692.99 Safari/537.36"
Step 4 — Examining Apache access log formats
The access log records all requests that are processed by the server. You can
see what resources are being requested, the status of each request, and how long
it took to process their response. In this section, we’ll dive deeper into how
to customize the information that is displayed in this file.
Before you can derive value from reading a log file, you need to understand the
format that is being used for each of its entries. The CustomLog directive is
what controls the location and format of the Apache access log file. This
directive can be placed in the server configuration file
(/etc/apache2/apache2.conf) or in your virtual host entry. Note that defining
the same CustomLog directive in both files may cause problems.
Let’s look at the common formats used in Apache access logs and what they mean.
Common Log Format
The Common Log Format
is the standardized access log format format used by many web servers because it
is easy to read and understand. It is defined in the /etc/apache2/apache2.conf
configuration file through the LogFormat directive.
When you run the command below:
sudo grep common /etc/apache2/apache2.conf
You will observe the following output:
LogFormat "%h %l %u %t "%r" %>s %O" common
The line above defines the nickname common and associates it with a particular
log format string. A log entry produced by this format will look like this:
127.0.0.1 alice Alice [06/May/2021:11:26:42 +0200] "GET / HTTP/1.1" 200 3477
Here’s an explanation of the information contained in the log message above:
%h->127.0.0.1: the hostname or IP address of the client that made the
request.%l->alice: remote log name (name used to log in a user). A placeholder
value (-) will be used if it is not set.%u->Alice: remote username (username of logged-in user). A placeholder
value (-) will be used if it is not set.%t->[06/May/2021:11:26:42 +0200]: the day and time of the request."%r"->"GET / HTTP/1.1"— the request method, route, and protocol.%>s->200— the response code.%O->3477— the size of the response in bytes.
Combined Log Format
The Combined Log Format
is very similar to the Common log format but contains few extra pieces of
information.
It’s also defined in the /etc/apache2/apache2.conf configuration file:
sudo grep -w combined /etc/apache2/apache2.conf
You will observe the following output:
LogFormat "%h %l %u %t "%r" %>s %O "%{Referer}i" "%{User-Agent}i"" combined
Notice that it is exactly the same as the Common Log Format, with the addition
of two extra fields. Entries produced in this format will look like this:
127.0.0.1 alice Alice [06/May/2021:11:18:36 +0200] "GET / HTTP/1.1" 200 3477 "-" "Mozilla/5.0 (Windows NT 10.0; Win64; x64) AppleWebKit/537.36 (KHTML, like Gecko) Chrome/90.0.4430.93 Safari/537.36"
Here’s an explanation of the two additional fields that are not present in the
Common log format:
"%{Referer}i"->"-": the URL of the referrer (if available, otherwise
-is used)."%{User-Agent}i"->
"Mozilla/5.0 (Windows NT 10.0; Win64; x64) AppleWebKit/537.36 (KHTML, like Gecko) Chrome/90.0.4430.93 Safari/537.36":
detailed information about the user agent of the client that made the request.
Step 5 — Creating a custom log format
You can define a custom log format in the /etc/apache2/apache2.conf file by
using the LogFormat directive followed by the actual format of the output and
a nickname that will be used as an identifier for the format. After defining the
custom format, you’ll pass its nickname to the CustomLog directive and restart
the apache2 service.
In this example, we will create a log format named custom that looks like
this:
LogFormat "%t %H %m %U %q %I %>s %O %{ms}T" custom
Open your /etc/apache2/apache2.conf file and place the line above below the
other LogFormat lines. It will produce access log entries with the following
details:
%t: date and time of the request.%H: the request protocol.%m: the request method.%U: the URL path requested.%q: query parameters (if any).%I: total bytes received including the request headers.%>s: final HTTP status code.%O: number of bytes sent in the response.%{ms}T: time taken to generate the response in milliseconds.
You can find all other formatting options and their description on
this page.
To enable the custom format for subsequent access log entries, you must change
the value of the CustomLog directive in your virtual hosts file and restart
the apache2 service with Systemctl.
Open up the default virtual hosts file using the command below:
sudo nano /etc/apache2/sites-available/000-default.conf
Find the following line:
CustomLog ${APACHE_LOG_DIR}/access.log combined
And change it to:
CustomLog ${APACHE_LOG_DIR}/access.log combined
Save the file by pressing Ctrl-O then Ctrl-X, then restart the apache2
service using the command below:
sudo systemctl restart apache2
Afterward, make the following request to your server using curl:
curl --head 'http://<your_server_ip>?name=john&age=30'
You should observe the following response:
HTTP/1.1 200 OK
Date: Mon, 07 Feb 2022 14:21:45 GMT
Server: Apache/2.4.41 (Ubuntu)
Last-Modified: Mon, 07 Feb 2022 12:57:29 GMT
ETag: "2aa6-5d76d24a738bc"
Accept-Ranges: bytes
Content-Length: 10918
Vary: Accept-Encoding
Content-Type: text/html
Go ahead and view the last 10 messages in the access log file:
sudo tail /var/log/apache2/access.log
The log entry that describes the request will look like this:
[07/Feb/2022:14:21:45 +0000] HTTP/1.1 HEAD /index.html ?name=john&age=30 96 200 255 0
It’s also possible to create multiple access log files by specifying the
CustomLog directive more than once. In the example below, the first line logs
into a custom.log file using the custom log format, while the second uses
the common format to write entries into access.log. Similarly, the
combined.log file contains messages formatted according to the combined log
format.
CustomLog ${APACHE_LOG_DIR}/custom.log custom
CustomLog ${APACHE_LOG_DIR}/access.log common
CustomLog ${APACHE_LOG_DIR}/combined.log combined
Step 6 — Formatting your logs as JSON
Although many log management systems support the default Apache logging formats,
it might be best to log in a structured format like JSON since that’s the go-to
format for structured logging in the industry and it is universally supported.
Here’s a conversion of our custom log format into JSON:
LogFormat "{ "timestamp":"%t", "protocol":"%H", "method":"%m", "request":"%U", "query":"%q", "request_size_in_bytes":"%I", "status_code":"%>s", "response_size_in_bytes":"%O", "time_taken_ms":"%{ms}T" }" json
This produces log entries with the following formatting:
{
  "timestamp": "[07/Feb/2022:15:09:02 +0000]",
  "protocol": "HTTP/1.1",
  "method": "HEAD",
  "request": "/index.html",
  "query": "?name=john&age=30",
  "request_size_in_bytes": "96",
  "status_code": "200",
  "response_size_in_bytes": "255",
  "time_taken_ms": "0"
}
Step 7 — Configuring Apache error logs
The server error log contains information about any errors that the web server
encountered while processing incoming requests as well as other diagnostic
information. You can choose where the error messages will be transported to
using the ErrorLog directive in your virtual host configuration file. This
transport is usually a log file on the filesystem.
Here is an example from default virtual host configuration file
/etc/apache2/sites-available/000-default.conf:
ErrorLog ${APACHE_LOG_DIR}/error.log
On Debian-based distributions, the default error log is in the
/var/log/apache2/error.log file, while in Fedora/CentOS/RHEL, it placed in the
/var/log/httpd/error_log file. If the path argument to ErrorLog is not
absolute, then it is assumed to be relative to the
ServerRoot.
A common practice is to monitor the error log continuously for any problems
during development or testing. This is easily achieved through the tail
command:
sudo tail -f /var/log/apache2/error.log
You will observe the following output:
[Mon Feb 07 13:03:43.445444 2022] [core:notice] [pid 10469:tid 140561300880448] AH00094: Command line: '/usr/sbin/apache2'
[Mon Feb 07 13:07:31.528850 2022] [mpm_event:notice] [pid 10469:tid 140561300880448] AH00491: caught SIGTERM, shutting down
[Mon Feb 07 13:07:31.626878 2022] [mpm_event:notice] [pid 10864:tid 140224997284928] AH00489: Apache/2.4.41 (Ubuntu) configured -- resuming normal operations
[Mon Feb 07 13:07:31.626980 2022] [core:notice] [pid 10864:tid 140224997284928] AH00094: Command line: '/usr/sbin/apache2'
[Mon Feb 07 13:13:25.966501 2022] [mpm_event:notice] [pid 10864:tid 140224997284928] AH00491: caught SIGTERM, shutting down
[Mon Feb 07 13:13:26.049222 2022] [mpm_event:notice] [pid 11268:tid 139760377875520] AH00489: Apache/2.4.41 (Ubuntu) configured -- resuming normal operations
[Mon Feb 07 13:13:26.049318 2022] [core:notice] [pid 11268:tid 139760377875520] AH00094: Command line: '/usr/sbin/apache2'
[Mon Feb 07 15:08:50.856388 2022] [mpm_event:notice] [pid 11268:tid 139760377875520] AH00491: caught SIGTERM, shutting down
[Mon Feb 07 15:08:50.940561 2022] [mpm_event:notice] [pid 12096:tid 140473452194880] AH00489: Apache/2.4.41 (Ubuntu) configured -- resuming normal operations
[Mon Feb 07 15:08:50.940669 2022] [core:notice] [pid 12096:tid 140473452194880] AH00094: Command line: '/usr/sbin/apache2'
Aside from logging directly to a file, you can also forward your logs to a
Syslog. You can do this by
specifying syslog
instead of a file path as the argument to ErrorLog:
Step 8 — Customizing the error log format
Like the Apache access logs, the format of the error messages can be controlled
through the ErrorLogFormat directive, which should be placed in the main
config file or virtual host entry. It looks like this:
ErrorLogFormat "[%{u}t] [%l] [pid %P:tid %T] [client %a] %M"
The above configuration produces a log entry in the following format:
[Mon Feb 07 15:52:57.234792 2022] [error] [pid 24372:tid 24507] [client 20.113.27.135:34579] AH01276: Cannot serve directory /var/www/html/: No matching DirectoryIndex (index.html) found, and server-generated directory index forbidden by Options directive
Here’s an explanation of the formatting options used above:
%{u}t: the current time, including microseconds. %l: the log level of the
message. %P: the process identifier. %T: the thread identifier. %a: the
client IP address. %M: the actual log message.
Note that when the data for a formatting option is not available in a particular
event, it will be omitted from the log entirely as the Apache error log doesn’t
use placeholder values for missing parameters.
You can find a complete description of all the available error formatting
options in the
Apache docs.
Step 9 — Customizing the error log level
In the virtual host configuration file, you can also control the level of
messages that will be entered into the error log through the
LogLevel directive.
When you specify a particular value, messages from all other levels of higher
severity will be logged as well. For example, when LogLevel error is
specified, messages with a severity of crit, alert, and emerg will also be
logged.
These are the levels available in increasing order of severity:
trace1—trace8: trace messages (lowest severity).debug: messages used for debugging.info: informational messages.notice: normal but significant conditions.warn: warnings.error: error conditions that doesn’t necessarily require immediate action.crit: critical conditions that requires prompt action.alert: errors that require immediate action.emerg: system is unusable.
If the LogLevel directive is not set, the server will set the log level to
warn by default.
Step 10 — Centralizing your Apache logs
Storing your Apache logs on the filesystem may suffice for development
environments or single-server deployments, but when multiple servers are
involved, it may be more convenient to centralize all your logs in a single
location so that you can automatically parse, filter, and search log data from
all sources in real-time.
In this section, we’ll demonstrate how you can centralize your Apache logs in a
log management service through Vector,
a high-performance tool for building observability pipelines. The following
instructions assume that you’ve signed up for a free
Logtail account and retrieved your source
token.
Go ahead and follow the relevant
installation instructions for Vector
for your operating system. On Ubuntu, you may run the following commands to
install the Vector CLI:
curl -1sLf 'https://repositories.timber.io/public/vector/cfg/setup/bash.deb.sh' | sudo -E bash
After Vector is installed, confirm that it is up and running through
systemctl:
You should observe that it is active and running:
● vector.service - Vector
     Loaded: loaded (/lib/systemd/system/vector.service; enabled; vendor preset: enabled)
     Active: active (running) since Tue 2022-02-08 10:52:59 UTC; 48s ago
       Docs: https://vector.dev
    Process: 18586 ExecStartPre=/usr/bin/vector validate (code=exited, status=0/SUCCESS)
   Main PID: 18599 (vector)
      Tasks: 3 (limit: 2275)
     Memory: 6.8M
     CGroup: /system.slice/vector.service
             └─18599 /usr/bin/vector
Otherwise, go ahead and start it with the command below.
sudo systemctl start vector
Afterwards, change into a root shell and append your Logtail vector
configuration for Apache into the /etc/vector/vector.toml file using the
command below. Don’t forget to replace the <your_logtail_source_token>
placeholder below with your source token.
wget -O ->> /etc/vector/vector.toml
    https://logtail.com/vector-toml/apache2/<your_logtail_source_token>
Then restart the vector service:
sudo systemctl restart vector
You will observe that your Apache logs will start coming through in Logtail:
Conclusion
In this tutorial, you learned about the different types of logs that the Apache
web server stores, where you can find those logs, and how to view their
contents. We also discussed Apache access and error log formatting and how to
create your custom log formats, including a structured JSON format. Finally, we
considered how you can manage all your Apache logs in one place by using the
Vector CLI to stream each entry to a log management service.
Don’t forget to read the docs to
find out more about all the logging features that Apache has to offer. Thanks
for reading!
Centralize all your logs into one place.
Analyze, correlate and filter logs with SQL.
Create actionable
dashboards.
Share and comment with built-in collaboration.
Got an article suggestion?
Let us know
![]()
![]()
![]()
Next article
How to View and Configure NGINX Access & Error Logs
Learn how to view and configure nginx access and error logs
→
![]()
This work is licensed under a Creative Commons Attribution-NonCommercial-ShareAlike 4.0 International License.
Практически любое ПО или служба в Linux ведут или могут вести логи.
Логи (лог-файлы) — это журналы, куда в процессе работы ПО или службы вносится служебная информация (события, уведомления, примечания, подробности, ошибки и др.), которая может потребоваться в будущем для анализа работы этого ПО или службы.
Относительно сервера чаще всего требуются логи:
-
веб-сервера (стоит учитывать, что у связок веб-сервера, например, nginx+php-fpm, свои логи у каждой службы);
-
почтового сервера;
-
FTP-сервера;
-
сервера базы данных (рассмотрим MySQL и PostgreSQL);
-
подсистемы авторизации;
-
системные логи.
Как правило, в Linux логи хранятся в специальном каталоге /var/log, внутри которого создаются отдельные файлы и папки для того или иного сервиса. Однако стоит учитывать, что для служб и ПО не запрещено задавать специальные каталоги для хранения логов. Например, для виртуальных хостов (сайтов) панель ISPmanager задает специальный каталог (/var/www/htttpd-logs) для удобного анализа логов по каждому сайту отдельно. А, например, стороннее ПО, устанавливаемое в директорию /opt, чаще всего будет вести логи также внутри этого каталога.
Стоит отметить, что несмотря на общую структуру, наименования отдельных файлов и каталогов могут отличаться в зависимости от определенной версии ОС, чаще всего разделяют на Debian-based (Debian/Ubuntu) и RedHat-based (Centos, Rocky Linux, AlmaLinux и т.д.), в статье мы будем разделять именно так.
Далее рассмотрим подробнее особенности вышеназванных наиболее популярных категорий журналов.
Системные логи
Начнем с системных логов как наиболее важных (система — основа работы сервера:)).
-
Системный журнал, как правило, записывается в файлы:
Debian-based:
/var/log/syslogRedHat-based:
/var/log/messages
Там находится много различной информации о событиях, процессах и ошибках практически от всех системных служб сервера и, в частности, сообщения от ядра Linux.Также к системному логу можно отнести:
/var/log/dmesg(для удобного просмотра этого журнала можно просто выполнить командуdmesg -T)
/var/log/kern.log
в этих файлах ведется журнал с сообщениями ядра и драйверов всех устройств сервера.Обратите внимание, что эти логи ведутся с момента старта системы, поэтому часто после ее аварийной перезагрузки довольно сложно узнать, что было, так как этого события уже нет в логе.
-
Логи авторизации.
Сюда вносится информация о входах в систему, в том числе и о неудачных попытках (полезно для отслеживания попыток подбора пароля к системе и выяснения, кто был на сервере)
Debian-based:
/var/log/auth.logRedHat-based:
/var/log/secure
-
Лог загрузки ОС:
/var/log/boot.log
-
Лог планировщика (CRON) системы:
/var/log/cron
Логи веб-сервера
В стандартных конфигурациях сайты осуществляют свою работу посредством таких веб-серверов, как Apache или Nginx. Они могут быть установлены как поодиночке, так и в связке, где Nginx будет отвечать за фронтенд, а Apache за бэкенд.
У Apache и Nginx есть свои логи, как правило, двух категорий: первая — хранит журнал посещений, вторая — хранит информацию об ошибках, уведомлениях, примечаниях, предупреждениях и т. д.
Также в связке с Nginx довольно часто устанавливается интерпретатор PHP (php-fpm), соответственно, он тоже имеет свой лог с ошибками и уведомлениями.
Логи веб-сервера Apache
Apache создает два лог-файла:
-
лог посещений (доступа) (
access.log/access_log); -
лог ошибок (
error.log/error_log).
Конфигурация Apache позволяет задать хранение этих файлов отдельно для каждого сайта, размещенного на сервере. Хороший пример — реализация журналов веб-сервера в панели ISPmanager — логи хранятся в директории /var/www/httpd-logs и называются domain.name.access.log и domain.name.error.log, где вместо domain.name — имя определенного домена. Могут быть и другие реализации хранения логов, это всегда отражено в конфигурационных файлах веб-сервера.
Что касается стандартной реализации, то логи на Debian-based системах хранятся в каталоге /var/log/apache2, а у RedHat-based систем в каталоге /var/log/httpd.
Логи веб-сервера Nginx
Nginx создает тоже два файла, хранящих журнал посещений и журнал ошибок. Файлы находятся в каталоге /var/log/nginx. В случае конфигурации веб-сервера как связки Nginx с Apache, журналы Nginx иногда пишутся в одном файле с логами Apache, с одной стороны, это может быть удобно, но в некоторых случаях для обнаружения ошибок это может создать трудности.
Также как и в Apache, Nginx может быть настроен для ведения логов каждого сайта отдельно.
Пример отображения стандартных логов Nginx в консоли:

Файлы .gz — это архивы логов, созданные в результате ротации логов, о ней расскажем позже.
Логи PHP-интерпретатора
Стандартно PHP-интерпретатор входит в конфигурацию Apache как модуль PHP. В таком случае все ошибки PHP хранятся там же, где основной лог Apache.
Если интерпретатор PHP работает в виде службы PHP-FPM (например, для связки веб-сервера Nginx+PHP-fpm), то логи хранятся отдельно, в каталоге /var/log/php-fpm.
В PHP (через конфигурационный файл php.ini) возможно настроить запись ошибок в определенный лог-файл, либо задать запись ошибок на определенной странице в отдельный файл (это уже осуществляется через файл .htaccess в соответствующем каталоге сайта). Чаще всего для таких случаев задают имя файла php_error.log или просто error.log, располагаться они могут как в каталоге сайта, так и любом другом каталоге пользователя, проверить лучше непосредственно в конфигурации PHP и веб-сервера.
Логи почтовой службы
На серверах довольно часто, помимо веб-сервера, присутствует и почтовая служба для отправки и приема писем все с тех же сайтов или отдельно через электронные почтовые ящики. Наиболее популярной конфигурацией почты сейчас является связка Exim (отправка и прием писем по протоколу SMTP) и Dovecot с сортировщиком sieve (для доступа пользователей к почтовым ящикам по протоколу IMAP/POP3).
В этом случае логи Exim находятся в каталоге /var/log/exim, чаще всего интересует файл mainlog (в нем хранятся все события почтовой службы), еще есть panic.log (там находятся сообщения об ошибках).
У Dovecot же логи, как правило, пишутся в файл /var/log/maillog или /var/log/mail.log, в него заносится информация о доставке, приеме и сортировке писем.
Логи FTP
В качестве FTP-службы в Linux есть несколько вариантов ПО, но в целом методика ведения логов у каждого ПО примерно схожая. В папке /var/log создаются журналы FTP-сервера, в случае использования vsFTPd это будет файл vsftpd.log, а в случае proFTPd — proftpd.log. В случае PURE-FTPd поищите файл /var/log/pureftpd.log. Если лога FTP вы не обнаружите, скорее всего, он все равно ведется, но уже в системных логах, упомянутых выше, это:
- Debian-based:
/var/log/syslog
- RedHat-based:
/var/log/messages
Также некоторые FTP-службы имеют файл лога xferlog, в котором пишется информация обо всех передачах по протоколу FTP.
Логи сервера базы данных
Рассмотрим сначала наиболее распространенный сервер баз данных MySQL. В стандартной настройке он ведет лог в файле mysqld.log или mysql.log. Файл располагается в папке /var/log/mysql или /var/log/mariadb, в зависимости от используемой версии MySQL.
Однако чаще всего в этот файл задается ведение general log, он же лог запросов, но так как этот лог очень быстро заполняется и начинает занимать много места на диске, то без особой необходимости его ведение не включают, а в лог если что и пишется, то ошибки и уведомления. Они заносятся, как правило, в файл error.log или mysql_error.log.
Также сервер MySQL может создавать в этой папке файл отладки медленных запросов к базе данных. Обычно он называется mysql_slow.log.
Иногда, в случае если настроена репликация баз данных, включают и ведение бинарных логов, они заносятся в файл mysql-bin.log. Этот лог, помимо большого своего объема на диске, также может снизить производительность сервера баз данных, поэтому также без особой необходимости включать его ведение не стоит.
Относительно сервера баз данных PostgreSQL можно отметить, что ведение логов задается в разных случаях в совершенно разные директории. Стоит посмотреть значение переменной log_filename в конфигурационном файле PostgreSQL, если этот параметр не задан, но при этом параметр logging_collector в статусе on, то лог ведется по следующему пути:
- Debian-based:
/var/log/postgresql/postgresql-x.x.main.log
где x.x — номер версии PostgreSQL
- RedHat-based:
/var/lib/pgsql/data/pg_log
Ротация логов
Для сайтов, имеющих активную посещаемость или большое количество уведомлений и ошибок PHP на многих страницах сайта, размеры журналов могут очень быстро разрастись и в конечном итоге заполнить диск сервера. Для предотвращения этих ситуаций в Linux есть стандартный инструмент ротации логов — logrotate.
На примере логов веб-сервера работает он так. Раз в сутки (время можно задавать) файл лога, например, access.log переименовывается logrotate’ом в access.log.1 и проходит через gzip-сжатие, после чего получает имя access.log.1.gz. А вместо переименованного access.log тут же создается новый пустой файл с этим именем, куда и продолжает писаться информация о посещениях. На следующие сутки, уже при наличии файла access.log.1.gz, аналогично создается файл уже с именем access.log.2.gz, таким же образом далее все дни. Количество хранимых архивов и период можно настроить.
По такому же принципу ротируются логи и других служб — FTP, почтовой службы, системные логи.
Главная задача ротации логов — экономить место на диске, а также иметь понятную логику доступа к архивам логов. Однако в случае бесконтрольной и объемной записи в лог, пространство диска может очень быстро закончиться еще до момента срабатывания ротации логов. В этом случае необходимо настроить ротацию логов на более частый период, но, как правило, такие ситуации случаются нечасто, и можно вручную очистить лог — эту ситуацию мы рассматривали в другой нашей статье.
Чтение лог-файлов
Логи бывают разные, как и способы их чтения.
Стандартным советом для просмотра содержимого текстового файла был бы совет использовать команду:
cat имя.лога
Однако, в случае когда логи объемны и, например, активно ведутся целый день, команда cat вывалит на вас гору информации, неудобную для просмотра.
Она может быть полезна, только если вы ищите сразу в логе что-то определенное, например, ошибку:
cat имя.лога | grep err
Но даже в этом случае ошибку можно поискать сразу командой grep:
grep 'err' имя.лога
Без поиска же более логичен в данном случае просмотр лога через инструмент tail:
tail имя.лога— выведет последние 10 строк журнала,tail -n 100 имя.лога— выведет последние 100 строк журнала, числовое значение можно менять в зависимости от необходимого числа строк,tail -f имя.лога— просмотр лога в «прямом эфире», т. е. все поступаемые в лог записи тут же обновляются на экране, удобно для отслеживания ошибок, появляющихся после определенных действий.
Ну, а если все же требуется прочитать весь объемный лог или как минимум пробежаться глазами для отслеживания событий, для этого есть более удобный, чем cat, инструмент less:
less имя.лога — покажет первую страницу лога (те строки, которые поместятся на экран консоли), пролистывать можно клавишами «вверх»/«вниз» (построчно) и PageUp/PageDown (постранично).
Важно, для выхода из просмотра в less, просто нажмите клавишу q.
Также можно, не листая текст, найти в логе определенный фрагмент, просто начав печатать искомую фразу или фрагмент в поле с мигающим курсором, в начале напечатав символ / (для поиска вниз по тексту) и ? (для поиска вверх по тексту).
После ввода необходимой части текста, нажмите Enter, все участки текста, которые подходят условиям поиска, будут подсвечены.
Для быстрого перехода в конец файла, нажмите клавишу G, для перехода в начало файла — g.
В этой статье мы разобрали лишь базовые логи и базовые инструменты для работы с журналами сервера. Так как в системах Linux, по большей части, все создается единообразно, разобравшись с базовыми элементами и основными логами, вам не составит труда в будущем найти и поработать с логами каких-либо других служб, установленных на сервер.
Apache – the technology that powers the web. I’m not sure if that is correct, but I think that we wouldn’t see the world wide web in its current shape without it. Launched in 1995 and since April 1996, it has been the most popular web server around the world.
Because of handling your users’ requests, Apache serves as the front application. It is crucial to understand what your server is doing, what file users are accessing, from where they came, and much, much more.
The visibility that Apache logs give you is invaluable in understanding the traffic coming to your application, the errors that happen, and the performance of the user-facing elements. Today, we will look into what the Apache web server logs are, how to interpret them, and how to analyze them easily.
What Are Apache Logs?
Apache logs are text files that contain all the information on what the Apache server is doing. They provide insight into which resources were accessed, when they were accessed, who accessed them, and metrics related to that. They also include information about the errors that happened, resource mapping process, the final resolution of the connection, and many, many more.
In general, the whole Apache logging process comes in multiple phases. First, you need to store the logs somewhere for historical analytical purposes. Second, you need to analyze the logs and parse them to retrieve useful information and metrics. And finally, you may want to graph the data as the visual representation is easier to analyze and understand for a human person.
What Is the Apache Access Log?
The Apache access logs are text files that include information about all the requests processed by the Apache server. You can expect to find information like the time of the request, the requested resource, the response code, time it took to respond, and the IP address used to request the data.
Apache Access Logs Location
The location of the Apache server access log differs depending on the operating system that you are using.
- On Red Hat, CentOS, or Fedora Linux, the access logs can be found in the
/var/log/httpd/access_logby default. - On Debian and Ubuntu, you can expect to find the Apache logs in the
/var/log/apache2/access.logand - FreeBSD will have the Apache server access logs stored in
/var/log/httpd-access.logfile.
You can configure its location using the CustomLog directive, for example:
CustomLog "/var/log/httpd-access.log"
Apache Access Log Format Configuration
Before we learn about the different log formats, let’s discuss what the Apache HTTP can do when it comes to formatting. There are two most common access log types that you can use and that the Apache server will translate to meaningful information:
- Common Log Format
- Combined Log Format
The log formatting directives are used in combination with the LogFormat option:
LogFormat "%t %h %m "%r"" custom
The above line tells that the “%t %h %m ”%r”” format should be used and assigned to an alias called custom. After that, we can use the custom alias when defining Apache logging. For example:
CustomLog "logs/my_custom_log" custom
The above section will tell Apache to write logs in the logs/my_custom_log file with the format defined by the custom alias. The above configuration will result in logging:
- time of the request thanks to the %t directive,
- remote hostname thanks to the %h directive,
- HTTP method thanks to the %m directive,
- the first line of the request surrounded by double quotes thanks to the %r directive.
Of course, there are way more directives that can be used and the complete list can be found in the mod_log_config documentation of the Apache server.
Common Log Format
The Apache Common Log Format is one of the two most common log formats used by HTTP servers. You can expect it to see its definition to look similar to the following line:
LogFormat "%h %l %u %t "%r" %>s %b" common
Here’s how an access log from that log file looks like:
10.1.2.3 - rehg [10/Nov/2021:19:22:12 -0000] "GET /sematext.png HTTP/1.1" 200 3423
As you can see the following elements are present:
- %h, resolved into 10.1.2.3 – the IP address of the remote host that made the request.
- %l, remote log name provided by identd, in our case a hyphen is provided, which is a value that we can expect to be logged in a case when the information provided by the logging directive is not found or can’t be accessed.
- %u, resolved into rehg, the user identifier determined by the HTTP authentication.
- %t, the date and time of the request with the time zone, in the above case it is [10/Nov/2021:19:22:12 -0000]
- ”%r”, the first line of the request inside double quotes, in the above case it is: “GET /sematext.png HTTP/1.1”
- %>s, the status code reported to the client. This information is crucial because it determines whether the request was successful or not.
- %b, the size of the object sent to the client, in our case the object was the sematext.png file and its size was 3423 bytes.
Combined Log Format
The Apache Combined Log Format is another format often used with access logs. It’s very similar to the Common Log Format but includes two additional headers – the referrer and the user agent. Its definition looks as follows:
LogFormat "%h %l %u %t "%r" %>s %b "%{Referer}i" "%{User-agent}i"" combined
And the example log line produced by the above log line looks like this:
10.1.2.3 - grah [12/Nov/2021:14:25:32 -0000] "GET /sematext.png HTTP/1.1" 200 3423 "http://www.sematext.com/index.html" "Mozilla/5.0 (Windows NT 10.0; Win64; x64) AppleWebKit/537.36 (KHTML, like Gecko) Chrome/79.0.3945.74 Safari/537.36 Edg/79.0.309.43"
Custom Log Format
There is one more thing that we should discuss when it comes to Apache Server logging configuration – the CustomLog directive. We’ve already seen that configuration directive, but let’s discuss that in greater details.
Multiple Access Logs
It is possible to have multiple Apache access logs at the same time without any additional effort. We may want a limited set of information available in some files for quick scanning and the full log using the Combined Log Format if we need the complete information. For example, we could have three access log files – one that includes time, user agent, and the status code, the second that includes the time, IP address, and referrer used, and the third – the Common Log Format.
To do that we need to include multiple CustomLog sections in our configuration file:
LogFormat "%h %l %u %t "%r" %>s %b" common
CustomLog logs/agent_log "%t %{User-agent}i %>s"
CustomLog logs/referer_log "%t %h %{Referer}i"
CustomLog logs/access_log common
You can see that this time we didn’t use three separate LogFormat configuration options, but we’ve specified the apache log format in the CustomLog format line. This is also possible and very convenient when the formatting of the log lines is used only in that given file.
Conditional Logs
There are cases when you would like to write logs only when a certain condition is met. This is what Apache Server calls conditional logging. It is done by using the CustomLog directive and environment variables. For example, if you would like to log all requests accessing your PNG files in a separate file you can do that the following way:
SetEnvIf Request_URI .png$ png-image-log
CustomLog "png-access.log" common env=png-image-log
Logs Rotation and Piped Logs
Depending on the logging configuration and the traffic that your Apache servers are handling, logging can be extensive. All the logs that you keep on the machine take space and if you are not using a log centralization solution like Sematext Logs, you will have to deal with space and management of logs.
Let’s talk about log rotation first. Log rotation is a process of creating a new log file that the Apache HTTP server will start writing to and renaming the old log file, so it is no longer updated. The log rotation happens when you gracefully restart the server. That means that without any kind of client requests processing interruption a new log file is created. In production environments, you would like to restart the Apache servers though.
That’s why the Apache server supports piped logs. Instead of writing the log events to a file, you use the piped logs to send the log events to a different application that will handle the log processing – for example to rotatelogs:
CustomLog "|/usr/local/apache/bin/rotatelogs /var/log/access.log 86400" common
The rotatelogs application comes with Apache server and is capable of rotating logs without the need of restarting the server. The above example will result in rotating the /var/log/access.log file every 24 hours.
How to Read Apache Access Logs
Apache server access logs are just simple text files. They can be easily opened by any tool that can read such files. On Linux-based systems, this can be the cat command-line tool or tail if you want to monitor the log lines as they go.
There are two caveats, though. The first is access policies. You may not have access to the machines running Apache HTTP server and even if you do, you may not have read access to the appropriate log directories. The second is distribution. It is not uncommon to have multiple Apache servers distributed across multiple data centers. In such a case, it is way easier to use a dedicated observability tool such as Sematext Logs that will provide not only the option to look into the raw files but also aggregated information into the key metrics derived for them.
Understanding Apache Access Logs
Our Apache access logs files are easy to read and not hard to understand either. Just remember about the patterns that you’ve used in your configuration. We’ve already covered the common patterns that you can encounter in the Apache log files. Keep in mind that understanding the log files is even easier with log analysis tools that do the parsing for you and give you an aggregated view of the data which is easier to understand.
What Is the Apache Error Log?
So far, we’ve talked about the Apache access log that gives us information on the accessed resources. But it is not the only thing that we should be interested in. We should also care about everything related to errors. In fact, the error log is the most important log file for the Apache HTTP server.
The Apache error log is where all the errors that happened during the processing of the requests. The most important thing, though, is that the error log will contain information on what went wrong during the Apache server startup and it is very likely that it will also contain hints on how to fix the issue.
Apache Errors Logs Location
Where the Apache error log is stored differs depending on the operating system on which it is running.
- On Red Hat, CentOS, or Fedora Linux, the access logs can be found in the
/var/log/httpd/error_logby default. - On Debian and Ubuntu, you can expect to find the Apache logs in the
/var/log/apache2/error.log - FreeBSD will have the Apache server access logs in
/var/log/httpd-error.logfile.
You can configure its location using the ErrorLog directive, for example:
ErrorLog "/var/log/httpd-error.log"
Apache Error Log Format Configuration
Similar to the Apache access log, you can adjust the format of the error log. The Apache error log format is configured by using the ErrorLogFormat element, for example:
ErrorLogFormat “[%{u}t] [%-m:%l] [pid %P:tid %T] [client %a] %M”
The above configuration would produce an Apache error log entry similar to the following one:
[Wed Nov 10 10:21:23.811033 2021] [core:error] [pid 22308:tid 3212342123] [client 10.1.2.3] File does not exist: /usr/local/apache2/htdocs/favicon.ico
In the above example the following formatting options were used:
- %{u}t – the current time including microseconds,
- %-m – the module that produced the error,
- %l – the level of the log event,
- %P – process identifier,
- %T – thread identifier,
- %M – the actual log message.
The full description of the available formatting options is available in the official Apache Server documentation.
Log Levels
In addition to what we discussed so far there is one other thing worth mentioning – the level of log events. The LogLevel directive allows specifying the level of log messages on a per-module basis. For example, if we would like the main log level for all events to be set to the info level but have the error level only for the rewrite module, we could have a configuration directive as follows:
LogLevel info rewrite:error
The following logging levels are described in Apache server documentation:
- emerg
- alert
- crit
- error
- warn
- notice
- info
- debug
- trace1 – trace8
The emerg one is the log event that says that the system is unstable and the trace levels are used for very low-level information logging that you can probably skip.
How to View Apache Error Logs
Viewing the Apache server error logs is just as simple as opening the text file. The error logs are not different from the access logs, so they are just simple text files. You can use whatever tools you want to look into them. But keep in mind that looking into logs from multiple Apache servers distributed across multiple data centers can be challenging. That’s why we strongly suggest using log aggregation tools, such as Sematext Logs, for that job.
Apache Log File Management and Analysis with Sematext
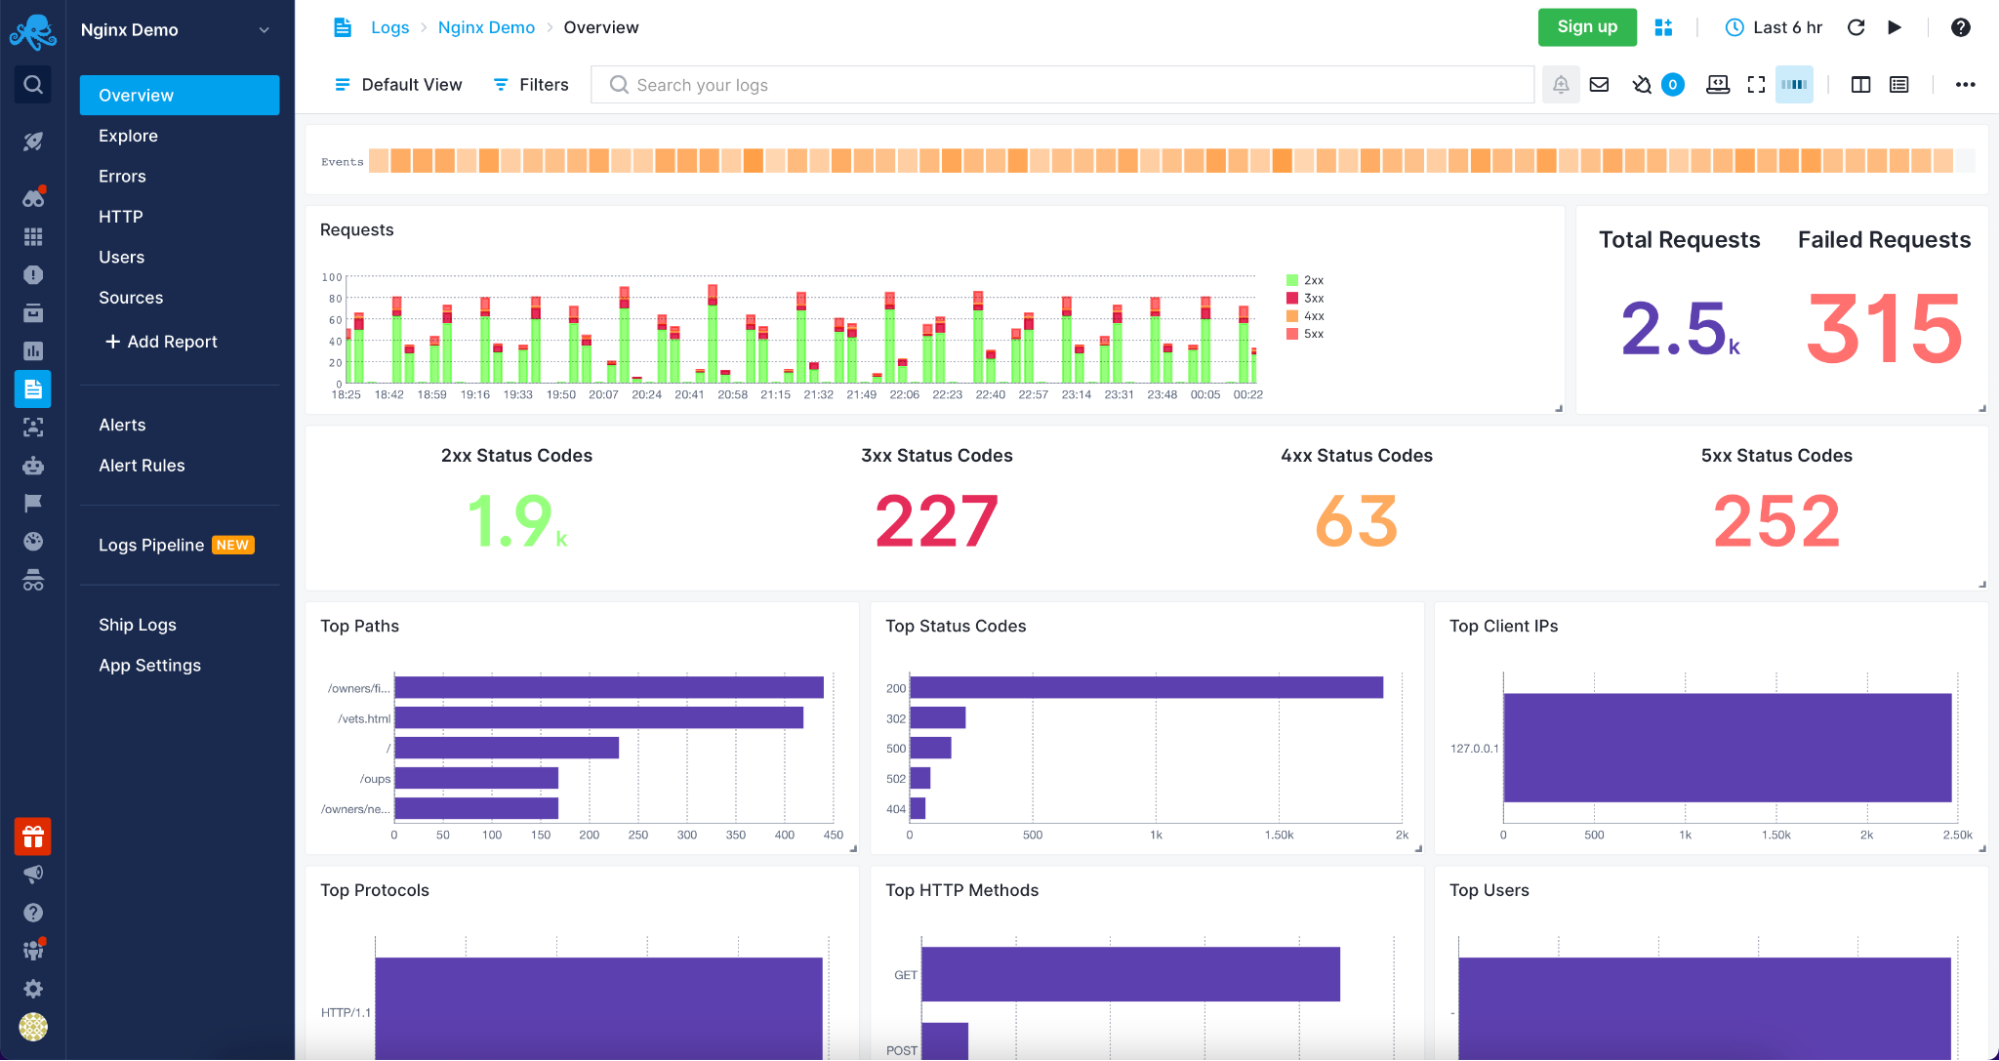
Sematext Cloud Logs – Apache Overview
Understanding and analyzing your Apache servers logs was never easier than with Sematext Logs. The only thing that you need to do is create an account with Sematext, create the Apache Logs App and install the Sematext Agent. You will be guided through the process of setting up the automatic Logs Discovery for your Logs. Your logs will be parsed and sent to the Sematext Logs giving you access to a variety of pre-built reports tailored for your Apache HTTP server.
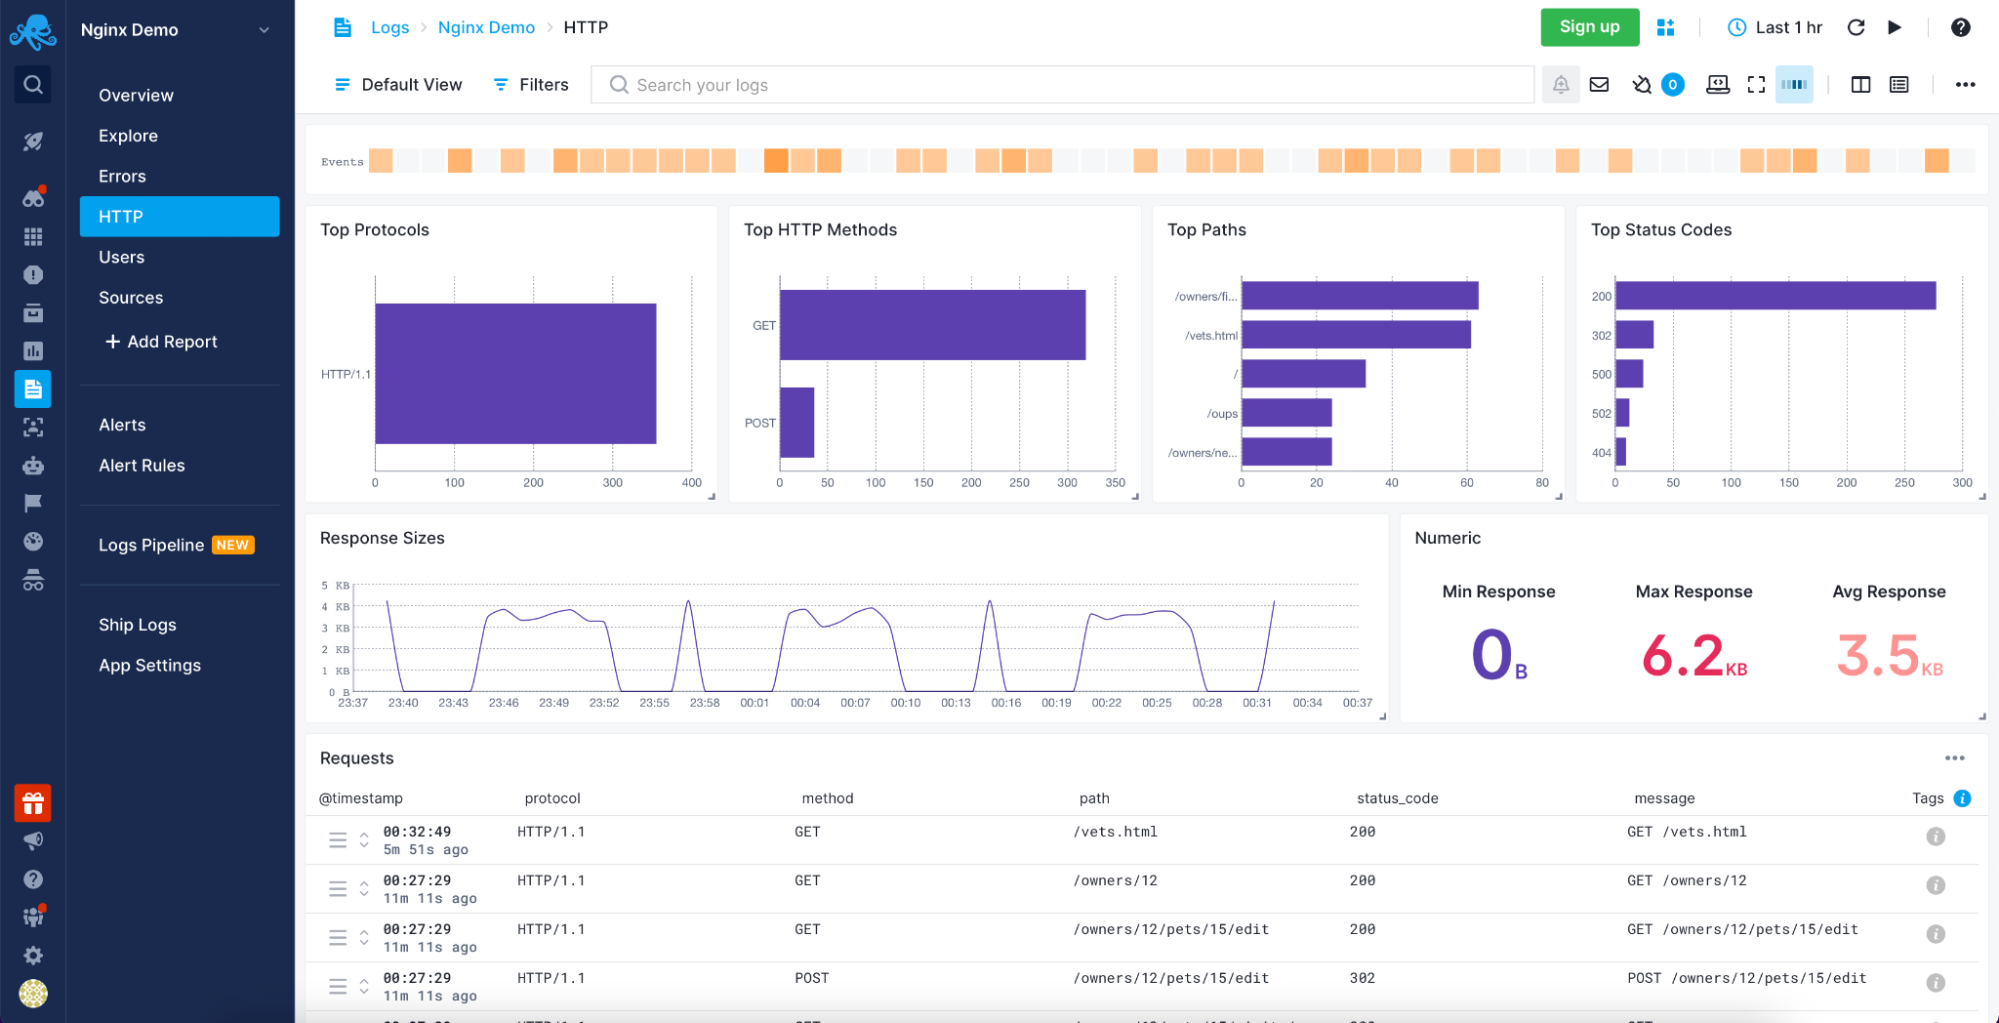
Sematext Logs – Apache HTTP Information
Sematext Logs is part of the Sematext Cloud full-stack monitoring solution providing you with all you need when it comes to observability. With Sematext Cloud, you get an overview of your Apache servers, errors report, HTTP report, including top HTTP methods and paths with an average response size visualization and requests table. You can see your users with the top User Agents used to access resources served by your Apache servers and, finally, the sources for the data. All within a single Apache Logs monitoring in Sematext Cloud.
Still not sure which open-source search engine to use? Check out this quick video comparing Apache Solr and Elasticsearch below:
Conclusion
Analyzing your Apache servers logs is invaluable in understanding the traffic coming to your application, the errors that happen, and the performance of the user-facing elements. A log management tool such as Sematext Logs does this job for you.
More than understanding server logs, knowing what resources were accessed, who accessed them, and how long it took to process the request is crucial to understanding your user’s behavior. You also need to be sure that you are aware of every error that happens so that you can react as soon as possible. Combining that with the need for distributed infrastructures to handle a large number of concurrent users and provide high availability, using an observability tool is a necessity.
Having Apache metrics and logs in the same place, being able to slice and dice them, being alerted when issues appear and having insight into every piece of your environment is no longer something good to have but need to have. All of that and more is provided by Sematext Cloud, an observability platform with dedicated Apache server logs and metrics support. Built with simplicity in mind and requiring no credit card, nothing stops you from giving it a try to see how it can improve your log management and log analysis processes.
Start Free Trial
25 ноября, 2015 11:53 дп
16 097 views
| Комментариев нет
Ubuntu
Веб-сервер Apache может предоставлять администратору много полезной информации о своей работе, а также о проблемах и ошибках, которые нужно устранить.
Вовремя настроенное журналирование позволяет в дальнейшем избежать неожиданных проблем с веб-сервером. Информация, хранящаяся в логах (или журналах) сервера, помогает быстро оценить ситуацию и устранить ошибки. Apache предоставляет очень гибкий механизм журналирования.
Данное руководство знакомит с возможностями журналирования Apache и предназначенными для этого инструментами.
Примечание: В данном руководстве используется Apache2 на сервере Ubuntu 12.04, но инструкции подойдут и для других дистрибутивов.
Уровни логирования
Apache делит все уведомляющие сообщения на категории в зависимости от важности соощения.
Для этого существуют уровни логирования. К примеру, наиболее важные сообщения, уведомляющие о критических ошибках и сбоях, существует уровень emerg. А сообщения уровня info просто предоставляют полезные подсказки.
Существуют следующие уровни логирования:
- emerg: критическая ситуация, аварийный сбой, система находится в нерабочем состоянии.
- alert: сложная предаварийная ситуация, необходимо срочно принять меры.
- crit: критические проблемы, которые необходимо решить.
- error: произошла ошибка.
- warn: предупреждение; в системе что-то произошло, но причин для беспокойства нет.
- notice: система в норме, но стоит обратить внимание на её состояние.
- info: важная информация, которую следует принять к сведению.
- Debug: информация для отладки, которая может помочь определить проблему.
- trace[1-8]: Трассировка информации различных уровней детализации.
При настройке логирования задаётся наименее важный уровень, который нужно вносить в лог. Что это значит? Логи фиксируют указанный уровень логирования, а также все уровни с более высоким приоритетом. К примеру, если выбрать уровень error, логи будут фиксировать уровни error, crit, alert и emerg.
Для настройки уровня логирования существует директива LogLevel. Уровень логирования по умолчанию задан в стандартном конфигурационном файле:
sudo nano /etc/apache2/apache2.conf

. . .

LogLevel warn

. . .
Как видите, по умолчанию Apache вносит в лог сообщения уровня warn (и более приоритетных уровней).
Где находятся логи Apache?
Apache может разместить свои логи, используя общесерверные настройки ведения логов. Также можно настроить индивидуальное логирование для каждого отдельного виртуального хоста.
Общесерверные настройки логирования
Чтобы узнать, где находятся стандартные логи сервера, откройте конфигурационный файл. В Ubuntu это /etc/apache2/apache2.conf:
sudo nano /etc/apache2/apache2.conf
Найдите в файле строку:
ErrorLog ${APACHE_LOG_DIR}/error.log
Данная директива указывает на расположение лога, в котором Apache хранит сообщения об ошибках. Как видите, для получения префикса пути к каталогу используется переменная среды APACHE_LOG_DIR.
Чтобы узнать значение переменной APACHE_LOG_DIR, откройте файл envvars:
sudo nano /etc/apache2/envvars

. . .

export APACHE_LOG_DIR=/var/log/apache2$SUFFIX

. . .
Согласно этому файлу, переменная APACHE_LOG_DIR настроена на каталог /var/log/apache2. Это означает, что Apache соединит это значение с директивой в конфигурационном файле apache2.conf и будет вносить данные в лог /var/log/apache2/error.log.
sudo ls /var/log/apache2

access.log  error.log  other_vhosts_access.log
Как видите, тут находится лог ошибок error.log и несколько других логов.
Логирование виртуальных хостов
Файл access.log, упомянутый в конце предыдущего раздела, не настраивается в файле apache2.conf. Вместо этого разработчики поместили соответствующую директиву в файл виртуального хоста.
Откройте и просмотрите стандартный виртуальный хост:
sudo nano /etc/apache2/sites-available/default
Пролистайте файл и найдите следующие три значения, связанные с логированием:
. . .

ErrorLog ${APACHE_LOG_DIR}/error.log

LogLevel warn

CustomLog ${APACHE_LOG_DIR}/access.log combined

. . .
Местонахождение ErrorLog совпадает с его определением в стандартном конфигурационном файле. Эта строка не обязательно должна находиться в двух отдельных файлах; при изменении местонахождения этого лога в одном из файлов ошибки не возникнет.
Пользовательские логи
В предыдущем разделе строка, описывающая access.log, использует не такую директиву, как предыдущие строки для настройки логов. Она использует CustomLog:
CustomLog ${APACHE_LOG_DIR}/access.log combined
Эта директива имеет такой синтаксис:
CustomLog log_location log_format
В данном случае log_format (формат логов) является комбинированным (combined). Эта спецификация не является внутренней спецификацией Apache; она задаёт пользовательский формат, который определен в конфигурационном файле по умолчанию.
Снова откройте конфигурационный файл по умолчанию и найдите строку, определяющую формат combined:
sudo nano /etc/apache2/apache2.conf

. . .

LogFormat "%h %l %u %t "%r" %>s %O "{Referer}i" "%{User-Agent}i"" combined

. . .
Команда LogFormat определяет пользовательский формат логов, вызываемых директивой CustomLog.
Этот формат называется комбинированным (combined).
Примечание: Подробнее о доступных форматах можно узнать здесь.
Существует еще несколько распространённых форматов, которые можно использовать в определении виртуальных хостов. Можно также создавать свои собственные форматы.
Ротация логов Apache
Ротация логов – это процесс, подразумевающий отключение устаревших или слишком объёмных лог-файлов и их архивирование (на установленный период времени). Apache может вносит в лог довольно большие объёмы данных, следовательно, во избежание заполнения дискового пространства необходимо настроить ротацию логов.
Ротация логов может быть очень простой (как, например, отключение слишком больших логов), а может иметь и более сложную конфигурацию (то есть, функционировать как система архивирования и хранения старых логов).
Рассмотрим методы настройки ротации логов Apache.
Ротация логов вручную
Перемещать логи во время работы Apache нельзя. То есть, чтобы переместить в архив устаревшие или заполненные логи и заменить их новыми, нужно перезапустить сервер.
Это можно сделать вручную. Для этого нужно переместить устаревшие файлы, а затем, перезапустив Apache, обновить настройки веб-сервера и заставить его использовать новые логи.
Ниже приведён пример из документации Apache. Возможно, понадобится добавить в начало этих команд sudo.
mv access_log access_log.old

mv error_log error_log.old

apachectl graceful

sleep 600

[post-processing of log files]
Эти команды переместят файлы, перезапустят сервер и скажут ему подождать 600 секунд. Таким образом Apache сможет использовать старые лог-файлы, чтобы завершить регистрацию старых запросов. В течение этого времени новые запросы будут записаны в новые лог-файлы.
Имейте в виду: ротация логов вручную очень ненадёжна в больших серверных средах.
Утилита logrotate
По умолчанию система Ubuntu настраивает ротацию логов при помощи утилиты logrotate.
Данная программа может выполнять ротацию логов при соблюдении определенных критериев. Просмотреть события, включающие Logrotate для ротации логов, можно в файле /etc/logrotate.d/apache2:
sudo nano /etc/logrotate.d/apache2
В нём находится несколько параметров logrotate. Обратите внимание на первую строку:
/var/log/apache2/*.log {
Это значит, что logrotate будет выполнять ротацию только тех логов, которые находятся в /var/log/apache2. Имейте это в виду, если вы выбрали другой каталог для хранения в конфигурации Apache.
Как видите, логи ротируются еженедельно. Также тут есть раздел кода, перезапускающий Apache после ротации:
postrotate

/etc/init.d/apache2 reload > /dev/null

endscript
Эти строки автоматически перезапускают веб-сервер Apache после завершения ротации.
Примечание: К сожалению, настройки данного файла не охвачены в данном руководстве.
Ротация логов по каналам
Использование каналов вместо файлов – простой способ передать обработку вывода программе логирования. Это также решает проблему ротации логов, поскольку ротация может выполняться с помощью программы на серверной стороне (а не самим сервером Apache).
Чтобы логи обрабатывались программой логирования, принимающей стандартный вывод, замените следующую строку следующим образом:
CustomLog "| logging_program logging_program_parameters" combined
Apache запустит программу логирования во время загрузки и перезапустит её в случае ошибки или сбоя.
Для ротации логов можно использовать разные программы, но по умолчанию Apache поставляется с rotatelogs. Чтобы настроить эту программу, используйте:
CustomLog "| /path/to/rotatelog /path/of/log/to/rotate number_of_seconds_between_rotations" log_level
Аналогичную конфигурацию можно создать и для других программ.
Заключение
Конечно, это руководство охватывает только основы логирования Apache.
Правильная настройка механизмов логирования и разумное управление лог-файлами сэкономят немало времени и сил в случае возникновения проблем с сервером. Имея быстрый доступ к информации, которая поможет определить проблемы, можно в кратчайшие сроки исправить все ошибки.
Также очень важно следить за логами сервера, чтобы случайно не подвергнуть опасности конфиденциальную информацию.
Tags: Apache, Apache 2, Logrotate, Ubuntu 12.04