Время на прочтение
8 мин
Количество просмотров 12K
Всем привет! Вдохновленные успехом предыдущей статьи, которая была написана в преддверии запуска курса «Fullstack разработчик JavaScript«, мы решили продолжить серию статей для новичков и всех тех, кто только начинает заниматься программированием на языке JavaScript. Cегодня мы поговорим об ошибках, которые случаются в JS, а также о том, как именно с ними бороться.

Отдебажь за человека одну ошибку, и он будет благодарен тебе один пулл реквест. Научи его дебажить самостоятельно, и он будет благодарен тебе весь проект.
Неизвестный тимлид
Типичные ошибки начинающих
Итак, начнем с самых примитивных ошибок. Допустим, вы только недавно закончили изучать основы HTML и CSS и теперь активно принялись за программирование на JavaScript. Для примера: вы хотите, чтобы при клике на кнопку у вас открывалось, к примеру, скрытое до этого момента модальное окно. Так же вы хотите, чтобы у вас по нажатию на крестик это окно закрывалось. Интерактивный пример доступен здесь (я выбрал bitbucket из-за того, что его интерфейс мне кажется самым простым, да и не все же на гитхабе сидеть).
	let modal_alert = document.querySelector(".modal_alert")
	let hero__btn = document.querySelector(".hero__btn")
	let modal_close = document.querySelector(".modal-close ")
	//мы выбрали из DOM модели наши элементы. К слову, я использую bulma для упрощения процесса верстки

	//теперь мы хотим провести над нашими элементами какие-то операции:

	hero__btn.addEventListener("click", function(){
    	modal_alert.classList.add("helper_visible");
	})

	modal_close.addEventListener("click", function(){
    	modal_alert.classList.remove("helper_visible");
	})
//если мы хотим увидеть форму, то просто вешаем доп. класс, в котором прописано css-свойство display:flex. И наоборот, если хотим скрыть.
В нашем index.html, кроме верстки, мы внутри тэга head вставляем наш script:
<script src="code.js"></script>
В index.html кроме верстки внутри тэга head мы вставляем наш script:
<script src="code.js"></script>
Однако, несмотря на то, что мы все подключили, ничего не заработает и вылетит ошибка:
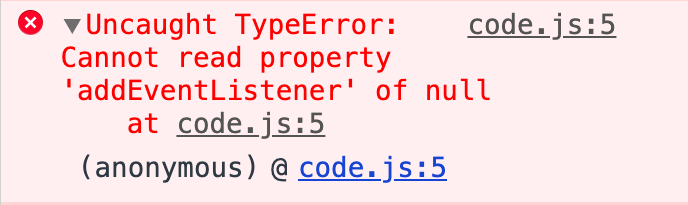
Что весьма печально, новички часто теряются и не понимают, что делать с красными строчками, словно это приговор какой-то, а не подсказка о том, что не так в вашей программе. Если перевести, то браузер говорит нам, что он не может прочитать свойство addEventListener нулевого значения. Значит, почему-то из DOM модели мы не получили наш элемент. Какой алгоритм действий нужно предпринять?
Во-первых, посмотрите в какой момент у вас вызывается javascript. Браузер читает ваш html-код сверху вниз, как вы читаете, например, книгу. Когда он увидит тэг script, то сразу исполнит его содержимое и продолжит чтение следующих элементов, не особо заботясь о том, что в своем скрипте вы пытаетесь получить элементы DOM, а он их еще не прочитал и, следовательно, не построил модель.
Что делать в таком случае? Просто добавьте атрибут defer внутрь вашего тэга скрипт (или async, но я не буду сейчас вдаваться в подробности их работы, это можно прочитать здесь ). Или можете просто переместить вниз ваш тэг script перед закрывающим body, это тоже сработает.
Во-вторых, проверьте опечатки. Изучите методологию БЭМ — она полезна ещё и тем, что вы хорошо знаете, как пишется ваш элемент — ведь пишите классы по единой логике, и стараетесь пользоваться только правильным английским языком. Или копируете сразу название элемента в JS файл.
Отлично. Теперь, когда вы поправили ошибки, можете насладиться рабочей версией кода по следующему адресу.
Загадочная ошибка
Больше всего новичков вводит в ступор странная ошибка последней строчки кода. Приведем пример:

В консоли выводится что-то непонятное. Если переводить, то буквально это «Неожиданный конец ввода» — и что с этим делать? Кроме того, новичок по привычке смотрит на номер строки. На ней вроде все нормально. И почему тогда консоль на нее указывает?
Все просто. Что бы понимать, как интерпретировать вашу программу, интерпретатору JS нужно знать, где заканчивается тело функции, и где заканчивается тело цикла. В данном варианте кода я абсолютно намеренно забыл последнюю фигурную скобку:
	// тут у нас просто два массива с заголовками и статьями
	let root = document.getElementById("root"); // реактно подобно использую root
	let article__btn = document.querySelector("article__btn");
	// при клике на кнопку прочитаем статью

	article__btn.onclick = () => {
		for (let i = 0; i < headers.length; i++) {
			root.insertAdjacentHTML("beforeend", `
		<div class="content is-medium">
			<h1>${headers[i]} </h1>
			<p>${paragraps[i]}</p>
		</div>`)
		//изъятие фигурной скобки выполнено профессионалами. Не повторять на продакшене
	}
Теперь JavaScript не понимает, где у него конец тела функции, а где конец цикла и не может интерпретировать код.
Что делать в данном случае? В любом современном редакторе кода, если вы поставите курсор перед открывающей скобкой, подсветится его закрывающий вариант (если редактор еще не начал подчеркивать эту ошибку красным цветом). Просмотрите код еще раз внимательно, держа в голове, что в JS не бывает одиноких фигурных скобок. Проблемный вариант можно посмотреть здесь, а исправленный — вот тут.
Дробим код
Чаще всего стоит заниматься написанием кода, тестируя его работу небольшими кусочками.
Или как нормальный человек изучить TDD
К примеру, вам нужно простую программу, которая принимает данные на вход от пользователя, складывает их в массив и после этого выводит их средние значения:
	let input_number = prompt("Введите количество переменных");
	// определяем, какое количество переменных к нам придет
	let numbers = [];

	function toArray(input_number){
		for (let i = 0; i < input_number; i++) {
			let x = prompt(`Введите значение ${i}`);
			numbers.push(x); // и складываем значения в массив
		}
	}
	toArray(input_number);

	function toAverage(numbers){
		let sum = 0;
		for (let i = 0; i < numbers.length; i++) {
			sum += numbers[i];
		}
		return sum/numbers.length;
	}
	alert(toAverage(numbers));
На первый неискушенный взгляд, в данном коде вполне все нормально. В нем есть основная логика, раздробленная на две функции, каждую из которой можно применять потом отдельно. Однако опытный программист сразу скажет, что это не заработает, ведь из prompt данные к нам приходят в виде строки. Причем JS (таков его толерантно-пофигистичный характер) нам все запустит, но на выходе выдаст настолько невероятную чепуху, что даже будет непросто понять, как мы дошли до жизни такой. Итак, давайте попробуем что-нибудь посчитать в нашем интерактивном примере. Введем допустим число 3 в количество переменных, и 1 2 3 в поле ввода данных:
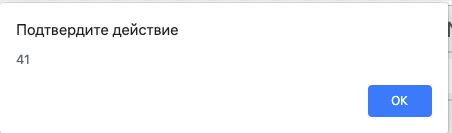
Что? Чего? Ладно, это JavaScript. Поговорим лучше, как мы могли бы избежать такого странного вывода.
Надо было писать на Python, он бы по-человечески предупредил нас об ошибке
. Нам надо было после каждого подозрительного момента сделать вывод типа переменных и смотреть, в каком состоянии находится наш массив.
Вариант кода, в котором вероятность неожиданного вывода снижена:
	let input_number = prompt("Введите количество переменных");

	console.log(typeof(input_number));
	let numbers = [];

	function toArray(input_number){
		for (let i = 0; i < input_number; i++) {
			let x = prompt(`Введите значение ${i}`);
			numbers.push(x);
		}
	}

	toArray(input_number);
	console.log(numbers);

	function toAverage(numbers){
		let sum = 0;
		for (let i = 0; i < numbers.length; i++) {
			sum += numbers[i];
		}
		return sum/numbers.length;
	}
	console.log(typeof(toAverage(numbers)));
	alert(toAverage(numbers));
Иными словами, все подозрительные места, в которых что-то могло пойти не так, я вывел в консоль, чтобы убедиться, что все идет так, как я ожидаю. Конечно, данные console.log — детские игрушки и в норме, естественно, нужно изучить любую приличную библиотеку для тестирования. Например эту. Результат этой отладочной программы можно увидеть в инструментах разработчика здесь. Как починить, я думаю, вопросов не будет, но если если интересно, то вот (и да, это можно сделать просто двумя плюсами).

Шаг вперед: осваиваем Chrome Dev Tools
Дебаг с использованием console.log в 2019 — это уже несколько архаичная штука (но мы все равно ее никогда ее не забудем, она уже нам как родная). Каждый разработчик, который мечтает носить гордое звание профессионала, должен освоить богатый инструментарий современных средств разработки.
Попробуем починить проблемные места в нашем коде с помощью Dev Tools. Если нужна документация с примерами, всё можно прочитать вот здесь. А мы попробуем разобрать предыдущий пример с помощью Dev Tools.
Итак, открываем пример. У нас явно запрятался какой-то баг в коде, но как понять, в какой момент JavaScript начал что-то неправильно считать?
Правильно, оборачиваем эту радость тестами на тип переменной, это же очень просто
Идем во вкладку Sources в инструментах разработчика. Откройте файл code.js. У вас будут 3 части: первая слева, в которой отображается список файлов и вторая — в которой у нас отображается код. Но больше всего информации мы сможете почерпнуть из третьей части снизу, в которой отображается ход выполнения нашего кода. Давайте поставим breakpoint на 15 строчке (для этого надо щелкнуть по номеру строки в окне, где у нас отображается код, после чего у вас появится голубая метка). Перезапустите страницу, и введите любые значения в нашу программу.
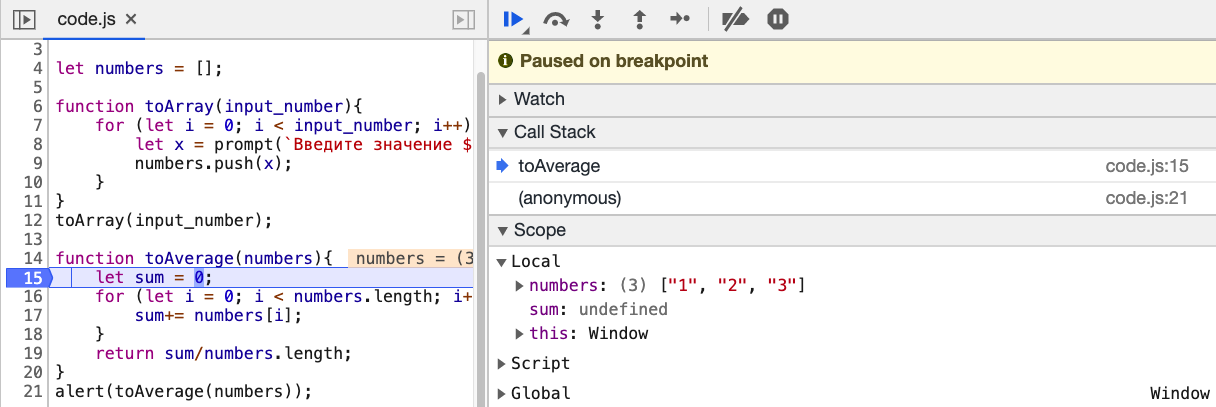
Теперь вы можете вытащить из нижней панели debug массу полезной информации. Вы обнаружите, что JS не особенно задумываясь над типом переменных
ведь статистические языки тупо лучше и нужно писать только на них, чтобы получать предсказуемо работающие и быстрые программы
складывает переменные в виде строки в наш массив. Теперь, осознав картину происходящего, мы можем принять контрмеры.
Учимся перехватывать ошибки
Конструкция try… catch встречается во всех современных языках программирования. Зачем эта синтаксическая конструкция нужна практически? Дело в том, что при возникновении ошибки в коде, он останавливает свое выполнение на месте ошибки — и все, дальнейшие инструкции интерпретатор не исполнит. В реально работающем приложении, из нескольких сотен строчек кода, нас это не устроит. И предположим, что мы хотим перехватить код ошибки, передать разработчику ее код, и продолжить выполнение дальше.
Наша статья была бы неполной без краткого описания основных типов ошибки в JavaScript:
- Error — общий конструктор объекта ошибки.
- EvalError — тип ошибки, появляющийся во время ошибок исполнения
eval(), но не синтаксических, а при неправильном использовании этой глобальной функции. - RangeError — происходит, когда вы выходите за пределы допустимого диапазона в исполнении вашего кода.
- ReferenceError — происходит, когда вы пытаетесь вызвать переменную, функцию или объект, которых нет в программе.
- SyntaxError — ошибка в синтаксисе.
- TypeError — происходит при попытке создания объекта с неизвестным типом переменной или при попытке вызова несуществующего метода
- URIError — редко встречающий код, который возникает при неправильном использовании методов encodeURL и DecodeURL.
Здорово, давайте теперь немного попрактикуемся и посмотрим на практике, где мы можем использовать конструкцию try… catch. Сам принцип работы данной конструкции совсем простой — интерпретатор пытается исполнить код внутри try, если получается — то все продолжается, словно этой конструкции никогда не было. А вот если произошла ошибка — мы ее перехватываем и можем обработать, к примеру, сказав пользователю, где именно он допустил промах.
Давайте создадим самый простой калькулятор (даже калькулятором его называть громко, я бы сказал:«исполнитель введенных выражений»). Его интерактивный пример можно найти здесь. Хорошо, давайте теперь посмотрим на наш код:
	let input = document.querySelector("#enter");
	let button = document.querySelector("#enter_button");
	let result_el = document.querySelector("#result ");

	button.onclick = () => {
		try {
			let result = eval(input.value); //пробуем, если все будет корректно, тогда catch не сработает
			result_el.innerHTML = result;
		} catch (error) {
			console.error(error.name);
			result_el.innerHTML = "Вы что-то не то ввели, молодой человек<br> Подумайте еще раз";
			//можно пользователю объяснять, что он не прав, если он допустил ошибку
			//хотя естественно пользователю лучше не давать эту возможность))
		}
	}
Если вы попробуете ввести корректное математическое выражение, то все сработает нормально. Однако попробуйте ввести некорректное выражение, к примеру, просто строку, тогда программа выведет пользователю соответствующее предупреждение.
Надеюсь, вы прочитаете еще статьи, в которых объясняются другие части перехвата ошибок, такие например, как эта , чтобы расширить свое понимание в отладке программ, и изучите другие синтаксические конструкции, такие как finally, а также генерацию своих собственных ошибок.
На этом все. Надеюсь, эта статья оказалась полезна и теперь, при отладке приложений, вы будете чувствовать себя более уверенно. Мы разобрали типичные ошибки от самых элементарных, которые делают новички программирующие на JS всего несколько дней, до техники перехвата ошибок, которые применяют более продвинутые разработчики.
И по традиции, полезные ссылочки:
- Пишем собственный фреймворк для тестирования. Полезно для общего понимания стратегии тестирования.
- Полная документация по ошибкам, в том числе и экспериментальные фичи
- Невероятно полезная статья на MDN, которая описывает большинство проблем, которые возникают в начале разработки на JS: отладку, полифиллы, дебагер и многое другое
На этом все. Ждем ваши комментарии и приглашаем на бесплатный вебинар, где поговорим о возможностях фреймворка SvelteJS.
JavaScript Errors Handbook
This README contains information that I’ve learned over the years about dealing with JavaScript errors, reporting them to the server, and navigating through a lot of bugs that can make this all really hard. Browsers have improved in this area, but there is still room left to improve to make sure that all applications can sanely and soundly handle any error that happens.
Test cases for content found in this guide can be found at https://mknichel.github.io/javascript-errors/.
Table of Contents
- Introduction
- Anatomy of a JavaScript Error
- Producing a JavaScript Error
- Error Messages
- Stack Trace Format
- Catching JavaScript Errors
- window.onerror
- try/catch
- Protected Entry Points
- Promises
- Web Workers
- Chrome Extensions
Introduction
Catching, reporting, and fixing errors is an important part of any application to ensure the health and stability of the application. Since JavaScript code is also executed on the client and in many different browser environments, staying on top of JS Errors from your application can also be hard. There are no formal web specs for how to report JS errors which cause differences in each browser’s implementation. Additionally, there have been many bugs in browsers’ implementation of JavaScript errors as well that have made this even harder. This page navigates through these aspects of JS Errors so that future developers can handle errors better and browsers will hopefully converge on standardized solutions.
Anatomy of a JavaScript Error
A JavaScript error is composed of two primary pieces: the error message and the stack trace. The error message is a string that describes what went wrong, and the stack trace describes where in the code the error happened. JS Errors can be produced either by the browser itself or thrown by application code.
Producing a JavaScript Error
A JS Error can be thrown by the browser when a piece of code doesn’t execute properly, or it can be thrown directly by code.
For example:
In this example, a variable that is actually a number can’t be invoked as a function. The browser will throw an error like TypeError: a is not a function with a stack trace that points to that line of code.
A developer might also want to throw an error in a piece of code if a certain precondition is not met. For example
if (!checkPrecondition()) {
  throw new Error("Doesn't meet precondition!");
}
In this case, the error will be Error: Doesn't meet precondition!. This error will also contain a stack trace that points to the appropriate line. Errors thrown by the browser and application code can be handled the same.
There are multiple ways that developers can throw an error in JavaScript:
throw new Error('Problem description.')throw Error('Problem description.')<— equivalent to the first onethrow 'Problem description.'<— badthrow null<— even worse
Throwing a string or null is really not recommended since the browser will not attach a stack trace to that error, losing the context of where that error ocurred in the code. It is best to throw an actual Error object, which will contain the error message as well as a stack trace that points to the right lines of code where the error happened.
Error Messages
Each browser has its own set of messages that it uses for the built in exceptions, such as the example above for trying to call a non-function. Browsers will try to use the same messages, but since there is no spec, this is not guaranteed. For example, both Chrome and Firefox use {0} is not a function for the above example while IE11 will report Function expected (notably also without reporting what variable was attempted to be called).
However, browsers tend to diverge often as well. When there are multiple default statements in a switch statement, Chrome will throw "More than one default clause in switch statement" while Firefox will report "more than one switch default". As new features are added to the web, these error messages have to be updated. These differences can come into play later when you are trying to handle reported errors from obfuscated code.
You can find the templates that browsers use for error messages at:
- Firefox — http://mxr.mozilla.org/mozilla1.9.1/source/js/src/js.msg
- Chrome — https://code.google.com/p/v8/source/browse/branches/bleeding_edge/src/messages.js
- Internet Explorer — https://github.com/Microsoft/ChakraCore/blob/4e4d4f00f11b2ded23d1885e85fc26fcc96555da/lib/Parser/rterrors.h
Browsers will produce different error messages for some exceptions.
Stack Trace Format
The stack trace is a description of where the error happened in the code. It is composed of a series of frames, where each frames describe a particular line in the code. The topmost frame is the location where the error was thrown, while the subsequent frames are the function call stack — or how the code was executed to get to that point where the error was thrown. Since JavaScript is usually concatenated and minified, it is also important to have column numbers so that the exact statement can be located when a given line has a multitude of statements.
A basic stack trace in Chrome looks like:
  at throwError (http://mknichel.github.io/javascript-errors/throw-error-basic.html:8:9)
  at http://mknichel.github.io/javascript-errors/throw-error-basic.html:12:3
Each stack frame consists of a function name (if applicable and the code was not executed in the global scope), the script that it came from, and the line and column number of the code.
Unfortunately, there is no standard for the stack trace format so this differs by browser.
Microsoft Edge and IE 11’s stack trace looks similar to Chrome’s except it explicitly lists Global code:
  at throwError (http://mknichel.github.io/javascript-errors/throw-error-basic.html:8:3)
  at Global code (http://mknichel.github.io/javascript-errors/throw-error-basic.html:12:3)
Firefox’s stack trace looks like:
  throwError@http://mknichel.github.io/javascript-errors/throw-error-basic.html:8:9
  @http://mknichel.github.io/javascript-errors/throw-error-basic.html:12:3
Safari’s format is similar to Firefox’s format but is also slightly different:
  throwError@http://mknichel.github.io/javascript-errors/throw-error-basic.html:8:18
  global code@http://mknichel.github.io/javascript-errors/throw-error-basic.html:12:13
The same basic information is there, but the format is different.
Also note that in the Safari example, aside from the format being different than Chrome, the column numbers are different than both Chrome and Firefox. The column numbers also can deviate more in different error situations — for example in the code (function namedFunction() { throwError(); })();, Chrome will report the column for the throwError() function call while IE11 reports the column number as the start of the string. These differences will come back into play later when the server needs to parse the stack trace for reported errors and deobfuscate obfuscated stack traces.
See https://developer.mozilla.org/en-US/docs/Web/JavaScript/Reference/Global_Objects/Error/Stack for more information on the stack property of errors. When accessing the Error.stack property, Chrome does include the error message as part of the stack but Safari 10+ does not.
The format of stack traces is different by browser in form and column numbers used.
Diving in more, there are a lot of nuances to stack trace formats that are discussed in the below sections.
Naming anonymous functions
By default, anonymous functions have no name and either appear as empty string or «Anonymous function» in the function names in the stack trace (depending on the browser). To improve debugging, you should add a name to all functions to ensure it appears in the stack frame. The easiest way to do this is to ensure that anonymous functions are specified with a name, even if that name is not used anywhere else. For example:
setTimeout(function nameOfTheAnonymousFunction() { ... }, 0);
This will cause the stack trace to go from:
at http://mknichel.github.io/javascript-errors/javascript-errors.js:125:17
to
at nameOfTheAnonymousFunction (http://mknichel.github.io/javascript-errors/javascript-errors.js:121:31)
In Safari, this would go from:
https://mknichel.github.io/javascript-errors/javascript-errors.js:175:27
to
nameOfTheAnonymousFunction@https://mknichel.github.io/javascript-errors/javascript-errors.js:171:41
This method ensures that nameOfTheAnonymousFunction appears in the frame for any code from inside that function, making debugging much easier. See http://www.html5rocks.com/en/tutorials/developertools/async-call-stack/#toc-debugging-tips for more information.
Assigning functions to a variable
Browsers will also use the name of the variable or property that a function is assigned to if the function itself does not have a name. For example, in
var fnVariableName = function() { ... };
browsers will use fnVariableName as the name of the function in stack traces.
    at throwError (http://mknichel.github.io/javascript-errors/javascript-errors.js:27:9)
    at fnVariableName (http://mknichel.github.io/javascript-errors/javascript-errors.js:169:37)
Even more nuanced than that, if this variable is defined within another function, all browsers will use just the name of the variable as the name of the function in the stack trace except for Firefox, which will use a different form that concatenates the name of the outer function with the name of the inner variable. Example:
function throwErrorFromInnerFunctionAssignedToVariable() {
  var fnVariableName = function() { throw new Error("foo"); };
  fnVariableName();
}
will produce in Firefox:
throwErrorFromInnerFunctionAssignedToVariable/fnVariableName@http://mknichel.github.io/javascript-errors/javascript-errors.js:169:37
In other browsers, this would look like:
at fnVariableName (http://mknichel.github.io/javascript-errors/javascript-errors.js:169:37)
Firefox uses different stack frame text for functions defined within another function.
displayName Property
The display name of a function can also be set by the displayName property in all major browsers except for IE11. In these browsers, the displayName will appear in the devtools debugger, but in all browsers but Safari, it will not be used in Error stack traces (Safari differs from the rest by also using the displayName in the stack trace associated with an error).
var someFunction = function() {};
someFunction.displayName = " # A longer description of the function.";
There is no official spec for the displayName property, but it is supported by all the major browsers. See https://developer.mozilla.org/en-US/docs/Web/JavaScript/Reference/Global_Objects/Function/displayName and http://www.alertdebugging.com/2009/04/29/building-a-better-javascript-profiler-with-webkit/ for more information on displayName.
IE11 doesn’t support the displayName property.
Safari uses the displayName property as the symbol name in Error stack traces.
Programatically capturing stack traces
If an error is reported without a stack trace (see more details when this would happen below), then it’s possible to programatically capture a stack trace.
In Chrome, this is really easy to do by using the Error.captureStackTrace API. See https://github.com/v8/v8/wiki/Stack%20Trace%20API for more information on the use of this API.
For example:
function ignoreThisFunctionInStackTrace() {
  var err = new Error();
  Error.captureStackTrace(err, ignoreThisFunctionInStackTrace);
  return err.stack;
}
In other browsers, a stack trace can also be collected by creating a new error and accessing the stack property of that object:
var err = new Error('');
return err.stack;
However, IE10 only populates the stack trace when the error is actually thrown:
try {
  throw new Error('');
} catch (e) {
  return e.stack;
}
If none of these approaches work, then it’s possible to create a rough stack trace without line numbers or columns by iterating over the arguments.callee.caller object — this won’t work in ES5 Strict Mode though and it’s not a recommended approach.
Async stack traces
It is very common for asynchronous points to be inserted into JavaScript code, such as when code uses setTimeout or through the use of Promises. These async entry points can cause problems for stack traces, since they cause a new execution context to form and the stack trace starts from scratch again.
Chrome DevTools has support for async stack traces, or in other words making sure the stack trace of an error also shows the frames that happened before the async point was introduced. With the use of setTimeout, this will capture who called the setTimeout function that eventually produced an error. See http://www.html5rocks.com/en/tutorials/developertools/async-call-stack/ for more information.
An async stack trace will look like:
  throwError	@	throw-error.js:2
  setTimeout (async)
  throwErrorAsync	@	throw-error.js:10
  (anonymous function)	@	throw-error-basic.html:14
Async stack traces are only supported in Chrome DevTools right now, only for exceptions that are thrown when DevTools are open. Stack traces accessed from Error objects in code will not have the async stack trace as part of it.
It is possible to polyfill async stack traces in some cases, but this could cause a significant performance hit for your application since capturing a stack trace is not cheap.
Only Chrome DevTools natively supports async stack traces.
Naming inline scripts and eval
Stack traces for code that was eval’ed or inlined into a HTML page will use the page’s URL and line/column numbers for the executed code.
For example:
  at throwError (http://mknichel.github.io/javascript-errors/throw-error-basic.html:8:9)
  at http://mknichel.github.io/javascript-errors/throw-error-basic.html:12:3
If these scripts actually come from a script that was inlined for optimization reasons, then the URL, line, and column numbers will be wrong. To work around this problem, Chrome and Firefox support the //# sourceURL= annotation (Safari, Edge, and IE do not). The URL specified in this annotation will be used as the URL for all stack traces, and the line and column number will be computed relative to the start of the <script> tag instead of the HTML document. For the same error as above, using the sourceURL annotation with a value of «inline.js» will produce a stack trace that looks like:
  at throwError (http://mknichel.github.io/javascript-errors/inline.js:8:9)
  at http://mknichel.github.io/javascript-errors/inline.js:12:3
This is a really handy technique to make sure that stack traces are still correct even when using inline scripts and eval.
http://www.html5rocks.com/en/tutorials/developertools/sourcemaps/#toc-sourceurl describes the sourceURL annotation in more detail.
Safari, Edge, and IE do not support the sourceURL annotation for naming inline scripts and evals. If you use inline scripts in IE or Safari and you obfuscate your code, you will not be able to deobfuscate errors that come from those scripts.
Up until Chrome 42, Chrome did not compute line numbers correctly for inline scripts that use the sourceURL annotation. See https://bugs.chromium.org/p/v8/issues/detail?id=3920 for more information.
Line numbers for stack frames from inline scripts are incorrect when the sourceURL annotation is used since they are relative to the start of the HTML document instead of the start of the inline script tag (making correct deobfuscation not possible). https://code.google.com/p/chromium/issues/detail?id=578269
Eval stack traces
For code that uses eval, there are other differences in the stack trace besides whether or not it uses the sourceURL annotation. In Chrome, a stack trace from a statement used in eval could look like:
Error: Error from eval
    at evaledFunction (eval at evalError (http://mknichel.github.io/javascript-errors/javascript-errors.js:137:3), <anonymous>:1:36)
    at eval (eval at evalError (http://mknichel.github.io/javascript-errors/javascript-errors.js:137:3), <anonymous>:1:68)
    at evalError (http://mknichel.github.io/javascript-errors/javascript-errors.js:137:3)
In MS Edge and IE11, this would look like:
Error from eval
    at evaledFunction (eval code:1:30)
    at eval code (eval code:1:2)
    at evalError (http://mknichel.github.io/javascript-errors/javascript-errors.js:137:3)
In Safari:
Error from eval
    evaledFunction
    eval code
    eval@[native code]
    evalError@http://mknichel.github.io/javascript-errors/javascript-errors.js:137:7
and in Firefox:
Error from eval
    evaledFunction@http://mknichel.github.io/javascript-errors/javascript-errors.js line 137 > eval:1:36
    @http://mknichel.github.io/javascript-errors/javascript-errors.js line 137 > eval:1:11
    evalError@http://mknichel.github.io/javascript-errors/javascript-errors.js:137:3
These differences can make it hard to parse eval code the same across all browsers.
Each browser uses a different stack trace format for errors that happened inside eval.
Stack traces with native frames
Your JavaScript code can also be called directly from native code. Array.prototype.forEach is a good example — you pass a function to forEach and the JS engine will call that function for you.
function throwErrorWithNativeFrame() {
  var arr = [0, 1, 2, 3];
  arr.forEach(function namedFn(value) {
    throwError();
  });
}
This produces different stack traces in different browsers. Chrome and Safari append the name of the native function in the stack trace itself as a separate frame, such as:
(Chrome)
    at namedFn (http://mknichel.github.io/javascript-errors/javascript-errors.js:153:5)
    at Array.forEach (native)
    at throwErrorWithNativeFrame (http://mknichel.github.io/javascript-errors/javascript-errors.js:152:7)

(Safari)
    namedFn@http://mknichel.github.io/javascript-errors/javascript-errors.js:153:15
    forEach@[native code]
    throwErrorWithNativeFrame@http://mknichel.github.io/javascript-errors/javascript-errors.js:152:14

(Edge)
    at namedFn (http://mknichel.github.io/javascript-errors/javascript-errors.js:153:5)
    at Array.prototype.forEach (native code)
    at throwErrorWithNativeFrame (http://mknichel.github.io/javascript-errors/javascript-errors.js:152:7)
However, Firefox and IE11 do not show that forEach was called as part of the stack:
namedFn@http://mknichel.github.io/javascript-errors/javascript-errors.js:153:5
throwErrorWithNativeFrame@http://mknichel.github.io/javascript-errors/javascript-errors.js:152:3
Some browsers include native code frames in stack traces, while others do not.
Catching JavaScript Errors
To detect that your application had an error, some code must be able to catch that error and report about it. There are multiple techniques for catching errors, each with their pros and cons.
window.onerror
window.onerror is one of the easiest and best ways to get started catching errors. By assigning window.onerror to a function, any error that is uncaught by another part of the application will be reported to this function, along with some information about the error. For example:
window.onerror = function(msg, url, line, col, err) {
  console.log('Application encountered an error: ' + msg);
  console.log('Stack trace: ' + err.stack);
}
https://developer.mozilla.org/en-US/docs/Web/API/GlobalEventHandlers/onerror describes this in more detail.
Historically, there have been a few problems with this approach:
No Error object provided
The 5th argument to the window.onerror function is supposed to be an Error object. This was added to the WHATWG spec in 2013: https://html.spec.whatwg.org/multipage/webappapis.html#errorevent. Chrome, Firefox, and IE11 now properly provide an Error object (along with the critical stack property), but Safari, MS Edge, and IE10 do not. This works in Firefox since Firefox 14 (https://bugzilla.mozilla.org/show_bug.cgi?id=355430) and in Chrome since late 2013 (https://mikewest.org/2013/08/debugging-runtime-errors-with-window-onerror, https://code.google.com/p/chromium/issues/detail?id=147127). Safari 10 launched support for the Error object in window.onerror.
Safari (versions below 10), MS Edge, and IE10 do not support an Error object with a stack trace in window.onerror.
Cross domain sanitization
In Chrome, errors that come from another domain in the window.onerror handler will be sanitized to «Script error.», «», 0. This is generally okay if you really don’t want to process the error if it comes from a script that you don’t care about, so the application can filter out errors that look like this. However, this does not happen in Firefox or Safari or IE11, nor does Chrome do this for try/catch blocks that wrap the offending code.
If you would like to receive errors in window.onerror in Chrome with full fidelity from cross domain scripts, those resources must provide the appropriate cross origin headers. See https://mikewest.org/2013/08/debugging-runtime-errors-with-window-onerror for more information.
Chrome is the only browser that will sanitize errors that come from another origin. Take care to filter these out, or set the appropriate headers.
Chrome Extensions
In old versions of Chrome, Chrome extensions that are installed on a user’s machine could also throw errors that get reported to window.onerror. This has been fixed in newer versions of Chrome. See the dedicated Chrome Extensions section below.
window.addEventListener(«error»)
The window.addEventListener("error") API works the same as the window.onerror API. See http://www.w3.org/html/wg/drafts/html/master/webappapis.html#runtime-script-errors for more information on this approach.
Showing errors in DevTools console for development
Catching errors via window.onerror does not prevent that error from also appearing in the DevTools console. This is most likely the right behavior for development since the developer can easily see the error. If you don’t want these errors to show up in production to end users, e.preventDefault() can be called if using the window.addEventListener approach.
Recommendation
window.onerror is the best tool to catch and report JS errors. It’s recommended that only JS errors with valid Error objects and stack traces are reported back to the server, otherwise the errors may be hard to investigate or you may get a lot of spam from Chrome extensions or cross domain scripts.
try/catch
Given the above section, unfortunately it’s not possible to rely on window.onerror in all browsers to capture all error information. For catching exceptions locally, a try/catch block is the obvious choice. It’s also possible to wrap entire JavaScript files in a try/catch block to capture error information that can’t be caught with window.onerror. This improves the situations for browsers that don’t support window.onerror, but also has some downsides.
Doesn’t catch all errors
A try/catch block won’t capture all errors in a program, such as errors that are thrown from an async block of code through window.setTimeout. Try/catch can be used with Protected Entry Points to help fill in the gaps.
try/catch blocks wrapping the entire application aren’t sufficient to catch all errors.
Deoptimizations
Old versions of V8 (and potentially other JS engines), functions that contain a try/catch block won’t be optimized by the compiler (http://www.html5rocks.com/en/tutorials/speed/v8/). Chrome fixed this in TurboFan (https://codereview.chromium.org/1996373002).
Protected Entry Points
An «entry point» into JavaScript is any browser API that can start execution of your code. Examples include setTimeout, setInterval, event listeners, XHR, web sockets, or promises. Errors that are thrown from these entry points will be caught by window.onerror, but in the browsers that don’t support the full Error object in window.onerror, an alternative mechanism is needed to catch these errors since the try/catch method mentioned above won’t catch them either.
Thankfully, JavaScript allows these entry points to be wrapped so that a try/catch block can be inserted before the function is invoked to catch any errors thrown by the code.
Each entry point will need slightly different code to protect the entry point, but the gist of the methodology is:
function protectEntryPoint(fn) {
  return function protectedFn() {
    try {
      return fn();
    } catch (e) {
      // Handle error.
    }
  }
}
_oldSetTimeout = window.setTimeout;
window.setTimeout = function protectedSetTimeout(fn, time) {
  return _oldSetTimeout.call(window, protectEntryPoint(fn), time);
};
Promises
Sadly, it’s easy for errors that happen in Promises to go unobserved and unreported. Errors that happen in a Promise but are not handled by attaching a rejection handler are not reported anywhere else — they do not get reported to window.onerror. Even if a Promise attaches a rejection handler, that code itself must manually report those errors for them to be logged. See http://www.html5rocks.com/en/tutorials/es6/promises/#toc-error-handling for more information. For example:
window.onerror = function(...) {
  // This will never be invoked by Promise code.
};

var p = new Promise(...);
p.then(function() {
  throw new Error("This error will be not handled anywhere.");
});

var p2 = new Promise(...);
p2.then(function() {
  throw new Error("This error will be handled in the chain.");
}).catch(function(error) {
  // Show error message to user
  // This code should manually report the error for it to be logged on the server, if applicable.
});
One approach to capture more information is to use Protected Entry Points to wrap invocations of Promise methods with a try/catch to report errors. This might look like:
  var _oldPromiseThen = Promise.prototype.then;
  Promise.prototype.then = function protectedThen(callback, errorHandler) {
    return _oldPromiseThen.call(this, protectEntryPoint(callback), protectEntryPoint(errorHandler));
  };
Sadly, errors from Promises will go unhandled by default.
Error handling in Promise polyfills
Promise implementations, such as Q, Bluebird, and Closure handle errors in different ways which are better than the error handling in the browser implementation of Promises.
- In Q, you can «end» the Promise chain by calling
.done()which will make sure that if an error wasn’t handled in the chain, it will get rethrown and reported. See https://github.com/kriskowal/q#handling-errors - In Bluebird, unhandled rejections are logged and reported immediately. See http://bluebirdjs.com/docs/features.html#surfacing-unhandled-errors
- In Closure’s goog.Promise implementation, unhandled rejections are logged and reported if no chain in the Promise handles the rejection within a configurable time interval (in order to allow code later in the program to add a rejection handler).
Long stack traces
The async stack trace section above discusses that browsers don’t capture stack information when there is an async hook, such as calling Promise.prototype.then. Promise polyfills feature a way to capture the async stack trace points which can make diagnosing errors much easier. This approach is expensive, but it can be really useful for capturing more debug information.
- In Q, call
Q.longStackSupport = true;. See https://github.com/kriskowal/q#long-stack-traces - In Bluebird, call
Promise.longStackTraces()somewhere in the application. See http://bluebirdjs.com/docs/features.html#long-stack-traces. - In Closure, set
goog.Promise.LONG_STACK_TRACESto true.
Promise Rejection Events
Chrome 49 added support for events that are dispatched when a Promise is rejected. This allows applications to hook into Promise errors to ensure that they get centrally reported along with the rest of the errors.
window.addEventListener('unhandledrejection', event => {
  // event.reason contains the rejection reason. When an Error is thrown, this is the Error object.
});
See https://googlechrome.github.io/samples/promise-rejection-events/ and https://www.chromestatus.com/feature/4805872211460096 for more information.
This is not supported in any other browser.
Web Workers
Web workers, including dedicated workers, shared workers, and service workers, are becoming more popular in applications today. Since all of these workers are separate scripts from the main page, they each need their own error handling code. It is recommended that each worker script install its own error handling and reporting code for maximum effectiveness handling errors from workers.
Dedicated workers
Dedicated web workers execute in a different execution context than the main page, so errors from workers aren’t caught by the above mechanisms. Additional steps need to be taken to capture errors from workers on the page.
When a worker is created, the onerror property can be set on the new worker:
var worker = new Worker('worker.js');
worker.onerror = function(errorEvent) { ... };
This is defined in https://html.spec.whatwg.org/multipage/workers.html#handler-abstractworker-onerror. The onerror function on the worker has a different signature than the window.onerror discussed above. Instead of accepting 5 arguments, worker.onerror takes a single argument: an ErrorEvent object. The API for this object can be found at https://developer.mozilla.org/en-US/docs/Web/API/ErrorEvent. It contains the message, filename, line, and column, but no stable browser today contains the «Error» object that contains the stack trace (errorEvent.error is null). Since this API is executed in the parent page’s scope, it would be useful for using the same reporting mechanism as the parent page; unfortunately due to the lack of a stack trace, this API is of limited use.
Inside of the JS run by the worker, you can also define an onerror API that follows the usual window.onerror API: https://html.spec.whatwg.org/multipage/webappapis.html#onerroreventhandler. In the worker code:
self.onerror = function(message, filename, line, col, error) { ... };
The discussion of this API mostly follows the discussion above for window.onerror. However, there are 2 notable things to point out:
Firefox and Safari do not report the «error» object as the 5th argument to the function, so these browsers do not get a stack trace from the worker (Chrome, MS Edge, and IE11 do get a stack trace). Protected Entry Points for the
onmessage function within the worker can be used to capture stack trace information for these browsers.
Since this code executes within the worker, the code must choose how to report the error back to the server: It must either use postMessage to communicate the error back to the parent page, or install an XHR error reporting mechanism (discussed more below) in the worker itself.
In Firefox, Safari, and IE11 (but not in Chrome), the parent page’s
window.onerror function will also be called after the worker’s own onerror and the onerror event listener set by the page has been called. However, this window.onerror will also not contain an error object and therefore won’t have a stack trace also. These browsers must also take care to not report errors from workers multiple times.
Shared workers
Chrome and Firefox support the SharedWorker API for sharing a worker among multiple pages. Since the worker is shared, it is not attached to one parent page exclusively; this leads to some differences in how errors are handled, although SharedWorker mostly follows the same information as the dedicated web worker.
In Chrome, when there is an error in a SharedWorker, only the worker’s own error handling within the worker code itself will be called (like if they set self.onerror). The parent page’s window.onerror will not be called, and Chrome does not support the inherited AbstractWorker.onerror that can be called in the parent page as defined in the spec.
In Firefox, this behavior is different. An error in the shared worker will cause the parent page’s window.onerror to be called, but the error object will be null. Additionally, Firefox does support the AbstractWorker.onerror property, so the parent page can attach an error handler of its own to the worker. However, when this error handler is called, the error object will be null so there will be no stack trace, so it’s of limited use.
Error handling for shared workers differs by browser.
Service Workers
Service Workers are a brand new spec that is currently only available in recent Chrome and Firefox versions. These workers follow the same discussion as dedicated web workers.
Service workers are installed by calling the navigator.serviceWorker.register function. This function returns a Promise which will be rejected if there was an error installing the service worker, such as it throwing an error during initialization. This error will only contain a string message and nothing else. Additionally, since Promises don’t report errors to window.onerror handlers, the application itself would have to add a catch block to the Promise to catch the error.
navigator.serviceWorker.register('service-worker-installation-error.js').catch(function(error) {
  // error typeof string
});
Just like the other workers, service workers can set a self.onerror function within the service workers to catch errors. Installation errors in the service worker will be reported to the onerror function, but unfortunately they won’t contain an error object or stack trace.
The service worker API contains an onerror property inherited from the AbstractWorker interface, but Chrome does not do anything with this property.
Worker Try/Catch
To capture stack traces in Firefox + Safari within a worker, the onmessage function can be wrapped in a try/catch block to catch any errors that propagate to the top.
self.onmessage = function(event) {
  try {
    // logic here
  } catch (e) {
    // Report exception.
  }
};
The normal try/catch mechanism will capture stack traces for these errors, producing an exception that looks like:
Error from worker
throwError@http://mknichel.github.io/javascript-errors/worker.js:4:9
throwErrorWrapper@http://mknichel.github.io/javascript-errors/worker.js:8:3
self.onmessage@http://mknichel.github.io/javascript-errors/worker.js:14:7
Chrome Extensions
Chrome Extensions deserve their own section since errors in these scripts can operate slightly differently, and historically (but not anymore) errors from Chrome Extensions have also been a problem for large popular sites.
Content Scripts
Content scripts are scripts that run in the context of web pages that a user visits. These scripts run in an isolated execution environment so they can access the DOM but they can not access JavaScript on the parent page (and vice versa).
Since content scripts have their own execution environment, they can assign to the window.onerror handler in their own script and it won’t affect the parent page. However, errors caught by window.onerror in the content script are sanitized by Chrome resulting in a «Script error.» with null filename and 0 for line and column. This bug is tracked by https://code.google.com/p/chromium/issues/detail?id=457785. Until that bug is fixed, a try/catch block or protected entry points are the only ways to catch JS errors in a content script with stack traces.
In years past, errors from content scripts would be reported to the window.onerror handler of the parent page which could result in a large amount of spammy error reports for popular sites. This was fixed in late 2013 though (https://code.google.com/p/chromium/issues/detail?id=225513).
Errors in Chrome Extensions are sanitized before being handled by window.onerror.
Browser Actions
Chrome extensions can also generate browser action popups, which are small HTML pages that spawn when a user clicks a Chrome extension icon to the right of the URL bar. These pages can also run JavaScript, in an entirely different execution environment from everything else. window.onerror works properly for this JavaScript.
Reporting Errors to the Server
Once the client is configured to properly catch exceptions with correct stack traces, these exceptions should be reported back to the server so they can be tracked, analyzed, and then fixed. Typically this is done with a XHR endpoint that records the error message and the stack trace information, along with any relevant client context information, such as the version of the code that’s running, the user agent, the user’s locale, and the top level URL of the page.
If the application uses multiple mechanisms to catch errors, it’s important to not report the same error twice. Errors that contain a stack trace should be preferred; errors reported without a stack trace can be hard to track down in a large application.
![]() Download Article
Download Article
![]() Download Article
Download Article
If you’re seeing an error that says «a JavaScript error occurred in the main process» or «a fatal JavaScript error occurred» when trying to open or install Discord, there are several potential fixes. While these fixes are designed to resolve this error on Discord, they should work to resolve similar errors in other apps, including Microsoft Teams. We’ll show you how to troubleshoot JavaScript errors for Discord, Microsoft Teams, and other Windows 10 apps.
-

1
Open your antivirus or antimalware software. If you’re unable to install Discord or another app on your PC because of a JavaScript error, such as «a JavaScript error occurred in the main process,» your antivirus software may be blocking the installer. You can fix this by adding an exclusion for the installer.
- If you’re using Windows Security, which comes for free with Windows, type security into the search bar and then click Windows Security.
- The remaining steps will cover unblocking an installer with Windows Security, but your antivirus suite may have different menu options.
-

2
Go to the Virus and threat protection area. This gives you a general overview of your antivirus settings.
Advertisement
-

3
Click Manage settings. This opens the settings for your antivirus protection.
-

4
Add an exclusion for the Discord installer. If you’re using Windows Security, click Add an exclusion, select File, and then open your download folder and select DiscordSetup.exe (or the name of the installer you’re trying to run).
-

5
Run the installer again. Once you’ve allowed the installer to run, you should resolve JavaScript errors that occur during installation.
Advertisement
-

1
Close Discord (or the app you’re trying to fix). If you get a JavaScript error when trying to launch or install Discord or another app, the application data may be corrupt. If the app is running right now, you’ll want to close it so you can properly delete and reinstall it. Make sure it’s not minimized to your taskbar.
- To be sure it’s closed, press Control + Alt + Delete and click Task Manager. If you see a that the app is running, click to select it, and then click End Task.[1]
- Even if you’ve only tried installing the app and were not successful, you should still use this method before you try to install again.
- To be sure it’s closed, press Control + Alt + Delete and click Task Manager. If you see a that the app is running, click to select it, and then click End Task.[1]
-

2
Press ⊞ Win+S. This activates the Windows search bar.
-

3
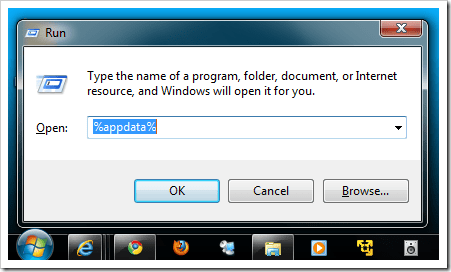
Type %appdata% and press ↵ Enter. This opens a File Explorer window to your application data.
-

4
Permanently delete the folder for the app you’re trying to fix. For example, if you’re trying to fix Discord, you’ll want to delete the «Discord» folder. Here’s how:
- Click the folder once to select it. Don’t open the folder—just select it for now.
- Hold down the Shift key as you press Delete.
- Click Yes.
-

5
Press ⊞ Win+S. This activates the Windows search bar again.
-

6
Type %LocalAppData% and press ↵ Enter. This opens a File Explorer window to your local app data.
-

7
Permanently delete the app’s folder here as well. Just hold down the Shift key as you press Delete, and then confirm deletion.
- If you don’t see this folder, just skip this step.
-

8
Uninstall Discord (or the app in question) from your PC. Here’s how:
- Open the Windows menu and click the Settings gear.
- Go to Apps > Apps & features.
- Select the app and click Uninstall. If you don’t see the app here, just move to the next step.
- Click Uninstall to confirm.
-

9
Reinstall the app. If you’re reinstalling Discord, you can download the installer from https://discord.com/download. Once downloaded, double-click the installer and follow the on-screen instructions—this should fix just about all installation errors.
Advertisement
-

1
Open your Windows Settings

. If you’re getting an error that says «a JavaScript error occurred in the main process» when trying to install Microsoft Teams, this may indicate a problem with the C++ libraries installed on your PC.[2]
- While this method is known to work for Teams, it may also resolve the same issue in other apps.
-

2
Click Apps. This opens the Settings panel to the Apps list.
-

3
Click Apps & Features. This option is in the left panel.[3]
-

4
Click the latest version of Microsoft Visual C++. You’ll probably see several instances of Visual ++ here—you’ll want to click the one that has the most recent date.
-

5
Click Change or Advanced options. You should see one of these two options here.
-

6
Click Repair. This performs a few repair steps to the C++ libraries.
- If prompted, enter your administrator password to confirm.
-

7
Try running the installer again. This should resolve most JavaScript installation errors with Microsoft Teams on Windows 10.
Advertisement
-

1
Close Discord (or the app you’re trying to fix). If you get a JavaScript error when trying to start Discord or another app, certain processes may be failing because they need more permissions. If the app is running right now, you’ll want to close it. Make sure it’s not minimized to your taskbar.
- To be sure it’s closed, press Control + Alt + Delete and click Task Manager. If you see a process for the app running, click to select it, and then click End Task.
-

2
Right-click the Discord icon on your desktop or in the Windows menu. A menu will expand.
-

3
Click Open file location. If you don’t see this option, you may have to click More first. This takes you to the app’s install location.
-

4
Double-click the latest version of Discord. If you’ve run a few Discord updates, you may have several folders beginning with app- and ending with a number. Double-click the one with the most recent version number.
- If you’re trying to fix a different app, you’ll usually see that app right here in the folder you’ve opened. If not, look around for a file with the app’s name—it may end with «.exe.»
-

5
Right-click the app and select Properties. Properties for the selected app will appear.
-

6
Click the Compatibility tab. It’s at the top of the window.
-

7
Check the box next to «Run this program as an administrator.» This gives the app permission to everything on your PC, which may clear up issues caused by access rights.
-

8
Click OK. This saves your changes.
-

9
Start Discord or your preferred app normally. Now that you’ve set the app to run as an administrator, starting it by double-clicking its icon on your desktop or in the Windows menu will run it with elevated privileges.
Advertisement
Add New Question
-
Question
Why am I getting a Javascript error with WordPress?

Luigi Oppido is the Owner and Operator of Pleasure Point Computers in Santa Cruz, California. Luigi has over 25 years of experience in general computer repair, data recovery, virus removal, and upgrades. He is also the host of the Computer Man Show! broadcasted on KSQD covering central California for over two years.
Computer & Tech Specialist
Expert Answer
Check the website on other devices, like another computer or a tablet. If the same error shows up, there’s an issue with the code that needs to be looked at. It also helps to make sure that Java is up-to-date on your computer, since a lot of people don’t even update Java anymore (since it’s updated with the operating system).
Ask a Question
200 characters left
Include your email address to get a message when this question is answered.
Submit
Advertisement
About This Article
Article SummaryX
1. Unblock the installer in your antivirus software.
2. Try deleting the app’s folders in AppData and LocalAppData and then reinstalling.
3. Repair the latest version of Microsoft Visual C++ in Apps & Features.
4. Run the app as an administrator.
Did this summary help you?
Thanks to all authors for creating a page that has been read 39,912 times.
Is this article up to date?
В ряде приложений и сайтов порой возникает ошибка Fatal JavaScript error. Чаще всего она встречается на сайте Вконтакте и в программе Дискорд, но это не единственные приложения. В ВК она мешает смотреть видеозаписи или прослушивать музыку, а Дискорд при этой неполадке полностью прекращает работу. Существует несколько разновидностей ошибки JavaScript error, однако обычно устранить их несложно.
Что за ошибка, почему возникает и где встречается
Ситуация: пользователь заходит на сайт Вконтакте и обнаруживает, что видеофайлы и аудиозаписи перестали воспроизводиться. Слева вверху страницы высвечивается надпись «JavaScript error: initAddMedia is not defined», сообщающая о синтаксической ошибке JavaScript: initAddMedia. Причины неполадки, как и текст сообщения могут быть различными, и для решения придется перепробовать несколько методов.
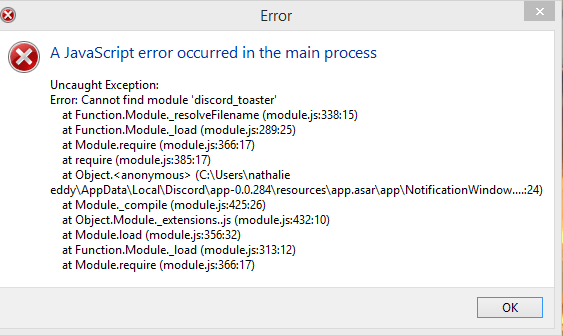
Похожая ошибка встречается и в клиенте Discord: «JavaScript error occurred in the main process» (ошибка возникла в главном процессе).
Независимо от программы и сообщения, она может возникать по нескольким причинам:
- конфликт процесса с прочими запущенными программами;
- оставшиеся файлы старой версии клиента конфликтуют с работающей;
- отсутствие свежих обновлений Windows;
- заражение вирусом.
Как устранить ошибку Вконтакте
Есть 3 основных способа исправления неполадки.
Очистка hosts
От пользователя требуется несколько простых действий:
- Открыть Мой компьютер, затем папку Windows/system32, далее папку driver, после etc.
- В каталоге etc открыть файл hosts через любой текстовый редактор (через контекстное меню найти строку «Открыть с помощью» и выбрать соответствующую программу).

- Всё, что должно находиться в файле, это строчка 127.0.0.1 localhost. Если есть что-то еще, то это мусор, препятствующий воспроизведению аудиозаписей и видеофайлов. Необходимо удалить все, оставив строку 127.0.0.1 localhost, затем сохранить изменения.
- Перезагрузить ПК.
Обновление Java и Adobe Flash Player
Следует зайти на официальные сайты Java и Adobe и скачать последние версии программ.
Очистка кэша браузера
Комбинация Ctrl + F5 очистит кэш страницы браузера, открытой в текущий момент. Нужно открыть сайт Вконтакте и нажать эти клавиши. Страница полностью перезагрузится, игнорируя кэширование.
Лучше очистить весь кэш браузера, а не только кэш одной страницы. Для этого нужно нажать комбинацию Ctrl + H, после чего откроется окно с историей браузера. Далее найти строку «очистить историю». Для очистки кэша браузеров можно использовать и сторонние программы, например, Ccleaner.
Как устранить ошибку в Дискорде
В клиенте Discord иногда возникает неполадка «JavaScript error occurred in the main process». Ниже будут описаны два способа борьбы с ней при запуске Дискорда. Хотя бы один метод точно сработает, поэтому если не помог один, обязательно нужно пробовать второй.
Обновление клиента
Иногда эта неполадка возникает из-за необходимости обновления, при том, что автоматическое обновление программы по каким-то причинам было отключено. Следует обновить клиент самому, следуя указаниям ниже:
- Открыть Диспетчер задач, отключить все процессы, связанные с Дискордом.
- Нажать комбинацию Win + R и набрать %AppData%.

- Выйти назад из Roaming в AppData.
- Далее зайти в папку Local и найти в ней папку Discord.
- Два раза нажать на Update.exe, инициирующий обновление программы.
- Включить Дискорд.
После выполнения всех шагов, при запуске программа станет обновляться. Когда установка обновлений завершится, следует проверить, перестала ли возникать эта неполадка. Если она продолжает появляться, необходимо приступить ко второму способу.
Переустановка клиента
Если первый способ не помог (он действительно помогает только в меньшинстве случаев), остается только полное удаление программы и ее чистая установка. Для этого нужно совершить следующую последовательность действий:
- Открыть Диспетчер задач, отключить все процессы, связанные с Дискордом.
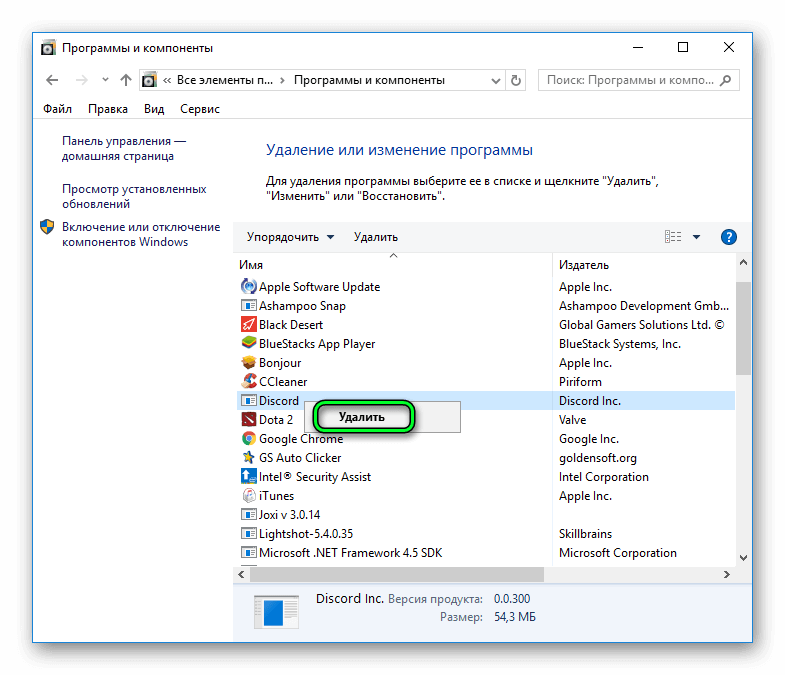
- В меню Панели управления найти пункт Программы и компоненты, открыть.
- Найти строку со словом Discord и удалить, после чего повторить пункты 2-4 из предыдущего способа, чтобы найти каталог Discord и удалить его. Затем выйти в AppData, зайти в Roaming и тоже удалить папку под названием Discord.
- Установить клиент Discord заново.
Другие способы
Если ошибка всё же не уходит, то остается проверить систему на предмет вирусов и установить свежие обновления системы Windows.
Если же JavaScript error возникает в других программах или в интернете, что наблюдается намного реже, то все вышеописанные способы будут работать. В случае с приложениями, можно выполнять те же действия, что и с Дискордом, но для нужной программы.
Другие варианты ошибки
Способы исправления всех ошибок идентичны, но иногда исправлять их не обязательно, главное понять, о чем именно предупреждает приложение или сервис:
- “A fatal JavaScript error occurred” (возникла фатальная ошибка) – возникает в Discord, приложение при этом вылетает. Исправляется обновлением или полной переустановкой клиента. Если это не помогает, нужно проверить программу антивирусом, предварительно отключив все процессы Discord, затем запустить программу от имени администратора.
- “JavaScript error: data is not a function” (данные не являются функцией) – возникает в ВК, не открываются сообщения. Обычно помогает очистка кэша браузера.
- “JavaScript error: wall is not defined” (стена не определена) – возникает Вконтакте при обновлении страницы, перестает работать стена. Решается обновлением Java, Adobe Flash Player, чисткой файла hosts, чисткой кэша браузера и перезагрузкой ПК.
- “JavaScript error: poster is not defined” (постер не определен), “JavaScript error: mediaselector is not defined” (медиаселектор не определен) – ошибки Вконтакте, при этом нельзя посмотреть новости и сообщения. Обычно решаются обновлением браузера, Java или Flash Player.
- “JavaScript error: scrollnode is not defined” (узел не определен) – ошибка ВК. Исправить ее нельзя, неполадки на стороне сервера.
- “JavaScript error: profile is not defined” (профиль не определен) – ошибка ВК, некорректно открываются страницы Вконтакте. Для исправления нужно очистить кэш, файл hosts и перезагрузить компьютер.
В целом способы исправления всех ошибок JavaScript идентичны, они актуальны и для таких расшифровок: timespent is not defined, mutations are not initialized, uisearch is not defined, upload is not defined, object is not a function, getaudioplayer updatecurrentplaying и других.
Если у вас на мониторе появляется предупреждение о сбое, значит ваш голосовой чат Discord завершил работу по причине ошибки «JavaScript error occurred in the main process». Это одна из многочисленных ошибок операционной системы Windows. Она используется для того, чтобы оповестить о сбое в конкретной области или программе. Многие ошибки могут быть исправлены с помощью простых пошаговых действий. Но некоторые исправить самостоятельно невозможно, необходимо обратиться за квалифицированной помощью специалиста. Ниже разберём, как исправить ошибку Javascript error occured.
Что означает?
Естественно, изначально нужно понять, что именно означает эта ошибка. Для этого воспользуемся любым онлайн-переводчиком, чтобы перевести фразу на русский язык. Получилось следующее: Ошибка JavaScript произошла в основном процессе.
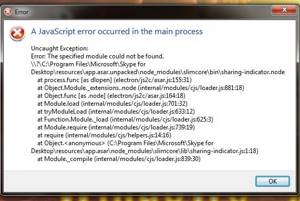
Теперь можно переходить к поиску решения. Разберем отдельно ситуации, когда сообщение «A javascript error occurred in the main process» возникает при запуске Discord и Skype.
Объект Error
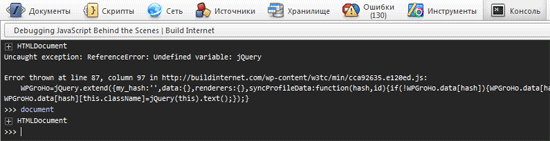
У экземпляров объекта Error есть несколько свойств, которыми мы можем пользоваться. Первое интересующее нас свойство — message. Именно сюда попадает та строка, которую можно передать конструктору ошибки в качестве аргумента. Например, ниже показано создание экземпляра объекта Error и вывод в консоль переданной конструктором строки через обращение к его свойству message.
Второе свойство объекта, очень важное, представляет собой трассировку стека ошибки. Это — свойство stack. Обратившись к нему можно просмотреть стек вызовов (историю ошибки), который показывает последовательность операций, приведшую к неправильной работе программы. В частности, это позволяет понять — в каком именно файле содержится сбойный код, и увидеть, какая последовательность вызовов функций привела к ошибке. Вот пример того, что можно увидеть, обратившись к свойству stack.
Здесь, в верхней части, находится сообщение об ошибке, затем следует указание на тот участок кода, выполнение которого вызвало ошибку, потом описывается то место, откуда был вызван этот сбойный участок. Это продолжается до самого «дальнего» по отношению к ошибке фрагмента кода.
Методика исправления для Дискорд
В этом случае существует ряд универсальных рекомендаций, которые обязательно стоит применить на практике:
Обновление программы
Да, иногда состояние A javascript error occurred in the main process как раз возникает из-за того, что этот продукт требует обновления, но нужный процесс, по каким-либо причинам, не активируется автоматически. Если это так, то придется все делать пользователю самостоятельно:
- Выйти из программы, зайти в диспетчер задач, просмотреть список запущенных процессов, отключить те, которые гарантированно связаны с Discord;
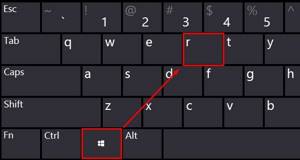
- На клавиатуре одновременно зажать кнопки «Win» и «R». Откроется строка «Выполнить». Использовать в ней команду %AppData%. И не забыть нажать на Ок или Enter для подтверждения;
- В открывшемся таким образом дереве каталогов необходимо сначала вернуться из папки «Roaming» в «AppData». Затем открыть папочку «Local», а ней – папку с одноименным названием нашей программы;
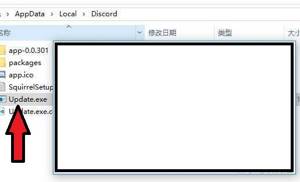
- Среди файлов обнаружить «update.exe». Запустить его.
Теперь можно спокойно закрывать все открытое. Возвращаться к иконке Дискорд. Нажать на нее, чтобы программа начала запускаться. Если все сделано правильно, то в этот момент ПО начнет выполнять свое обновление. Необходимо набраться терпения, подождать завершения запущенного процесса, проверить полученный результат.
Переустановка
Не помог предыдущий вариант? Переходим к следующему. Он подразумевает удаление программы и инсталляцию актуальной версии заново. Обычная деактивация в этой ситуации не поможет. Да, таким образом пользователь может удалить часть компонентов, но остатки программы все равно будут находиться на жестком диске. И именно они могут привести к повторению проблемы. Поэтому действовать нужно так:
- Естественно, полностью закрываем окно программы. То есть выходим из нее;
- Опять запускаем диспетчер задач и точно также, как в предыдущей ситуации, избавляется от всех программ, в названии которых присутствует слово «Discord»;
- Теперь нужно зайти в «программы и компоненты» через «Панель управления»;
- Просматриваем список, находит нужный нам продукт. Выделяем его, нажимаем на кнопочку, подразумевающую удаление ПО;
- Опять нажимаем «ВИН» и «R». Вбиваем все ту же команду: %AppData%. Подтверждаем ее;
- Совершаем переход: из Roaming» в «AppData», затем в «Local»;
- Находим папку с названием программы и удаляем ее.
Остается зайти в интернет. Желательно, на официальный сайт разработчиков. Скачиваем инсталлятор, запускаем его, проводим установку по инструкции.
Что еще можно попробовать
В девяти случаев из десяти вышеописанные методы прекрасно справляются с решение поставленной задачей. Но встречаются случаи, когда и они не помогают. Что рекомендуется попробовать именно в таких ситуациях:
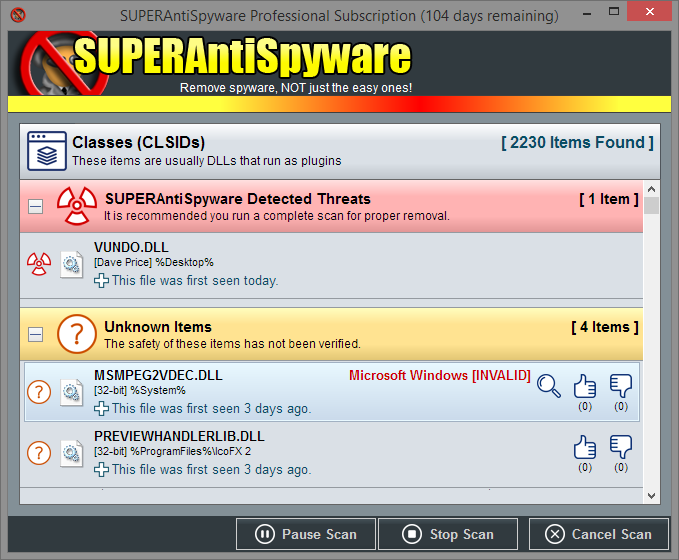
- Запустить хороший, актуальный антивирусник. Выполнить диагностику системы и ее лечение, если антивирусное ПО обнаружит какие-либо заражения. По возможности, для большей эффективности, желательно последовательно запустить несколько антивирусников;
- Если проблема начала возникать после установки какой-то другой программы, то следует подумать о том, что они просто между собой несовместимы. И деинсталляция недавно установленного ПО часто приводит к обнаружению нужного и эффективного решения.
SUPERAntiSpyware
Еще один не самый приятный момент – эта проблема реже встречается на относительно новых операционных системах. А вот на ОС, поддержка которых уже завершена корпорацией Майкрософт, чаще. Поэтому, если ни один из описанных способов не помог избавиться от ошибки, можно сделать только следующее:
- Полностью отказаться от использования этой проги. И попытаться найти ее альтернативу;
- Перейти на более современную операционную систему. А это, как минимум, Windows восьмой версии и выше.
Простые примеры выявления ошибок
Консоль поддерживает множество опций, но можно обойтись 3-4, этого достаточно для выявления и дальнейшего исправления ошибки. Из моего собственного опыта, функция log(), наиболее удобная. Она выводит новые сообщения, DOM элементы, переменные в консоль, где мы можем их видеть. Примеры ниже показывают применение функций, которые я использую.
В этом скрипте, консоль выводит разные результаты в зависимости значения переменной full_name (пустая или нет).
if (full_name != «»){ console.log(‘The name »‘ + full_name + ‘» was entered’); }else{ console.error(‘No name was entered’); }
Для события jQuery click, консоль выведет информацию о нажатии элемента (трассировка):
$(‘.trace’).click(function(){ //Запустить трассировку при событии onclick console.trace(); return false; });
Консоль это больше чем вывод сообщений, она также может принимать команды. Для примера, наберите «document» и нажмите Enter для получения информации о странице.
Исправляем для Скайпа
Да, к сожалению более известный продукт, известный, как Скайп, тоже сталкивается с аналогичной проблемой. Что предлагается сделать:
- В первую очередь – установить обновление Skype до наиболее актуальной версии. И многих пользователей программа присылает уведомления про необходимость апгрейда. И, если выставлены правильно настройки, при следующем запуске Скайп автоматически запускает процедуру. Но у некоторых людей, почему-то, этого не происходит. И их версия устаревает. Ее нужно обновить в ручном режиме: зайти на официальные сайт разработчиков, скачать актуальный вариант (естественно, подходящий под используемую систему и ее разрядность), выполнить установку скаченного пакета.
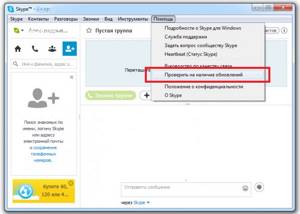
- Следующий этап – проверка версии фирменного браузера Майкрософт – Internet Explorer. И обновление его до одиннадцатой версии.
Процедура обновления IE до 11 версии
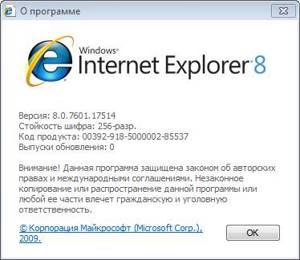
Итак, изначально узнаем текущую версию этого интернет-браузера:
- Запускаем сам браузер;
- В верхнем правом углу используем кнопку в виде шестеренки;
- Активируется выпадающее меню;
- В нем нужно выбрать пункт «О программе Internet Explorer». Нажать его и получить требуемую информацию.
Вообще сама эта программа должна обновляться автоматически. Если этого не произошло, рекомендуется выполнить следующие действия:
- Нажать внизу рабочего стола на кнопку «Пуск»;
- Через «параметры» и «обновление и безопасность» перейти в так называемый Центр обновления Виндовс;
- Нажать на предложение «проверить наличие обновлений».
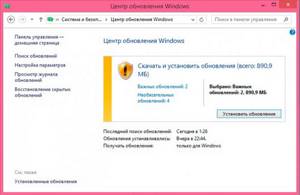
Подождать завершения запущенного процесса. Если система что-то обнаружит – выполнить установку.
В качестве альтернативы можно скачать с официального сайта корпорации Microsoft сразу же одиннадцатую версию этого веб-браузера. Естественно, предварительно выбрав используемую операционку и ее разрядность.
Сброс настроек IE
К этому пункту нужно будет перейти, если на винчестере гарантированно стоит 11-ая версия фирменного браузера от Майкрософт, а ошибка все равно продолжает проявляться при запуске Скайпа. Если это так, то нужно повторить следующие операции:
- Изначально закрыть абсолютно все запущенные приложения и окошки системы;
- Выполнить запуск IE;
- Нажать на иконку шестеренки и в списке выбрать пункт «Свойства браузера»;
- В следующем окне активировать вкладку «Дополнительно»;
- В ней выбрать «сброс параметров». Нажать на «сброс»;
- Подтвердить свои действия. И после завершения процедуры обязательно перезапустить персональный компьютер.
Проверить результат.
Настройка Java
Вполне логично, что Java скрипт должен быть правильно настроен. Ведь если не сделать этого, то вполне возможно проявление именно этой ошибки. Да, в первую очередь правильно выставить параметры следует как раз для Internet Explorer. Но если владелец ПК использует и другие браузеры, то перепроверить стоит и их.
Настройка для Internet Explorer
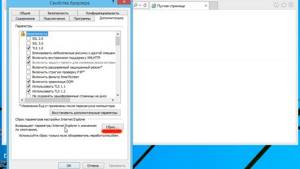
Требуется повторение следующей инструкции:
- Запустить веб-браузер, нажать на шестеренку и зайти в пункт «Свойства обозревателя»;
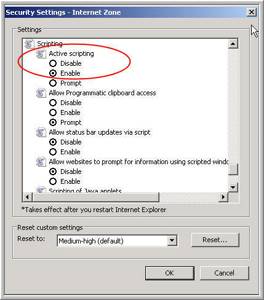
- Активировать вкладку, которая называется «Безопасность». Подсветить иконку «Интернет». Нажать на кнопку «Другой уровень»;
- Зайти в «Scripting». Дальше в – «Active Scripting». Выставить из трех значений то, которое называется «Enable»;
- Система запросит подтверждение. Нажать на да. Закрыть окно;
- Рядом с адресной строкой нажать кнопку, отвечающую за обновление страницы.
Настройка для Google Chrome
Естественно, изначально активируется Гугл Хром. Дальше:
- Нажать на три вертикальных точки, которые можно обнаружить в правом верхнем углу рабочего экрана;
- Появится выпадающее меню. В нем необходимо зайти в раздел «Настройки»;
- Опуститься до самого низа страницы. Нажать на «Дополнительно»;
- Перейти в «конфиденциальность и безопасность», где следует нажать на «настройки контента».
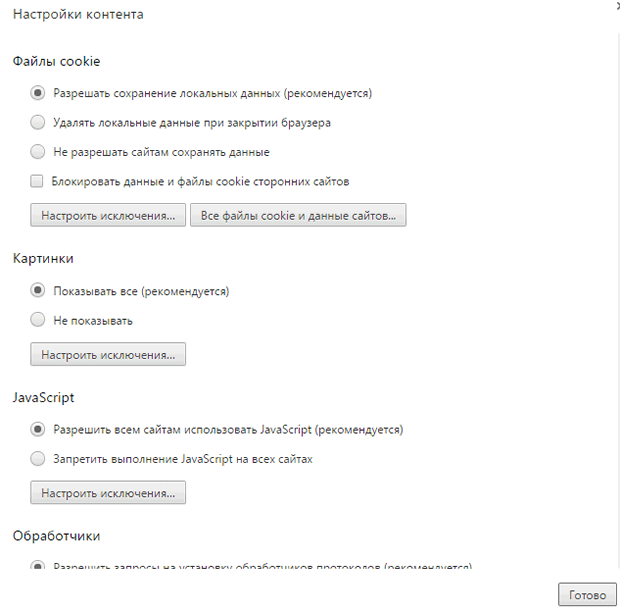
Остается выбрать «JavaScript» и установить значение – подключено.
Облегчаем себе жизнь
- Рекомендую взять за правило: перед началом каждой разработки централизовать любое логирование, особенно ошибок. С этой задачей помогут справиться библиотеки по типу log4js. Это сразу даст вам понять, ошибка в вашем приложении, либо извне.
- Используйте Брейкпоинты в DevTools! Это важно уметь делать. Это как машина времени программы, вы останавливаете интерпретатор на нужной строчке и вам даже не нужна консоль – просто смотрите значения переменных и поймете, что не так. Делается это простым кликом на нужной строчке во вкладке Source. Выбираете нужный файл, ставите брейкпоинт и перезапускаете программу. Для удаления брейкпоинта кликните на ту же строчку.
- Старайтесь перехватывать все ошибки и исключения на верхнем уровне.
- Хранение ошибок на сервере больше относится к проду, но имейте в виду, что готовый инструмент прекрасно справляется с данной задачей (см. ниже).
- Профилирование – тема тоже непростая, если вы знаете, что это измерение времени от начала до конца исполнения монады, вы уже на полпути. К счастью, DevTools позволяют делать замеры без вмешательства в код.
Эти правила априори необходимы, даже если вы опытный разработчик, вам всегда нужно знать, как ведет себя программа в конкретный момент времени.
Отзывы
Отзывы помогут разобраться, что именно помогло в аналогичной ситуации другим людям:
- Олег. Кстати, я со скайпом поступал также, как написано в инструкции по Дискорду. То есть, полностью удалял программу, предварительно очистив все ее следы, которые могли оказаться запущенным. А потом ставил новую версию, как говорится, с чистого листа. И у меня сразу же проблема оказалась устраненной.
- Семен. Сначала тоже полез все сносить из папки. Но система просто не дала это сделать, сообщив, что файлы, дескать, где-то еще открыты. Тогда зашел, как написано в инструкции, в диспетчер задач. Полностью все деактивировал. Еще раз перешел к удалению. И все получилось! Дальше – дело техники. Найти нормальный пакет, скачать его и установить.
- Валерий. Важный момент. При переходе к папкам, откуда нужно что-то удалять, убедитесь, что они не находятся в скрытом режиме. То есть, изначально нужно выставить настройки таким образом, чтобы все папочки на жестком диске оказались видны пользователю. Иначе вы просто не сможете обнаружить нужные вам элементы. А значит, завершить инструкцию.
- Аркадий. Перепробовал все. А тут, оказывается, надо еще Джаву включать в настройках IE. Специально перешел в нужный раздел. И увидел, что нужные скрипты находятся в неактивном состоянии. Конечно же, все выставил как надо. И скайп начал нормально функционировать. А то вечно вылетала эта ошибка, даже не знал, что с ней делать и как исправлять.
- Наталья. У меня буквально месяц назад появилась эта неприятность. А я не сильно разбираюсь в компьютерах. Позвала сына. Приехал посмотрел. Сказал, что у меня Скайп очень древний и его просто надо было обновить. Поставил нормальную версию. Сделал так, чтобы она обновлялась автоматически. Плюс сменил, наконец-то, стоявшую ранее XP, на современную Десятку. И теперь проблем не знаю – нормально общаюсь с подругами и по работе.
Так для чего же нужны эти приемы?
Ответ – для ведения простой и надежной разработки. Ваша задача как разработчика – делать отказоустойчивый код и при возникновении ошибки не дебажить все подряд, а сразу бить в «яблочко» и устранять проблему. Это попросту экономит ваше время, силы и деньги бизнеса.
Работайте с DevTools и выбрасывайте исключения, другие разработчики будут вам благодарны, опираясь на этот гайд. Обязательно ознакомьтесь, если не знали, вот пример:
// … /* обычный console.log может превратиться в нечто большее */ /* как правило, начинающие программисты логируют по одной переменной, мы же можем форматировать строки с любым количеством аргументов */ console.log(‘Check:rn username — %srn age — %irn data — %o’, ‘Mike’, 23, {status: ‘registered’}); /* Check: username — Mike age — 23 data — {status: «registered»} */ /* выводить таблицы массивов */ console.table([{username: ‘Mike’, age: 23}, {username: ‘Sarah’, age: 46}]); /* или просто логировать данные в их первоначальном виде */ console.dir(document.body.childNodes[1]); // …
Далее рассмотрим инструменты, которые собирают данные не только от компонентов, но и от сервисов (например, сетевые запросы, запросы к устройству и т.д.), а также сторонних библиотек и приложений, что кратно улучшает вашу производительность при обработке ошибок.
Как исправить ошибку «JavaScript error occurred in the main process»
Для исправления этой ошибки нужно на компьютере или ноутбуке открыть папку, куда была произведена установка файлов программы Discord. Нам понадобятся 2 папки программы Дискорд – «AppData» и «AppDataLocal». В некоторых версиях Windows папки могут быть скрыты по умолчанию. Поэтому чтобы открыть нужные нам папки:
- Откройте меню «Пуск».
- Выберите «Выполнить». Можно также нажать Win+R для быстрого доступа к строке «Выполнить» из рабочего стола.
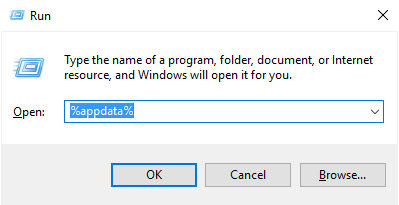
Асинхронные механизмы — промисы
Для выполнения асинхронных операций в JavaScript лучше использовать не коллбэки а промисы. Тут, в дополнение к улучшенной читабельности кода, имеются и более совершенные механизмы обработки ошибок. А именно, возиться с объектом ошибки, который может попасть в функцию обратного вызова, при использовании промисов не нужно. Здесь для этой цели предусмотрен специальный блок catch. Он перехватывает все ошибки, произошедшие в промисах, которые находятся до него, или все ошибки, которые произошли в коде после предыдущего блока catch. Обратите внимание на то, что если в промисе произошла ошибка, для обработки которой нет блока catch, это не остановит выполнение скрипта, но сообщение об ошибке будет не особенно удобочитаемым.
В результате можно порекомендовать всегда, при работе с промисами, использовать блок catch. Взглянем на пример.
Исправление ошибки А fatal JavaScript error occurred в Discord
Чтобы устранить ошибку подобного плана, необходимо провести следующие манипуляции:
- Заходим в меню Пуск.
- Забиваем Выполнить или же вызываем эту вкладку сочетанием клавиш Win+R.
- В появившемся окне вбиваем следующую фразу %localappdata% и %appdata%. Это позволит нам открыть скрытые папки, чтобы почистить их.
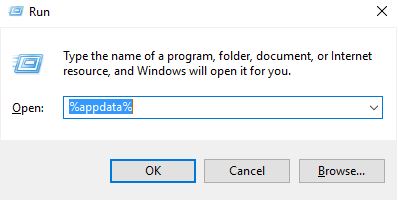
- Поочередно заходим в каждую из указанных папок и удаляем все файлы, в название которых фигурирует слово d
- Теперь следует полностью завершить работу мессенджера D Самый проверенный вариант – заходим в диспетчер задач, который проще всего вызвать сочетанием клавиш Ctrl+Alt+Del, и снимаем задачу Discord с работы.
- Далее удаляем полностью программу со своего устройства и заново ее переустанавливаем.
Если вы все правильно сделали, то после переустановки мессенджер Discord должен исправно заработать.
В случае же, когда при антивирусной проверке устройство указало на наличие ошибок и вирусов в самой программе, то в первую очередь необходимо почистить компьютер от вредоносных файлов.
Если после этого ошибка А fatal JavaScript error occurred в процессе работы Discord продолжает появляться, то тогда необходимо переустановить программу по описанному выше алгоритму.
Инструкция по чистке файла «хостс»
- Заходим в «Мой компьютер» и открываем системную папку Widows/system32. В ней имеется папка драйверов drivers, в которой нам нужна та, что называется etc. Среди файлов, хранящихся в этой последней папке, будет нужный нам hosts. Открываем его с помощью программы «Блокнот» либо текстового редактора WordPad.
- Вы увидите содержимое этого файла в виде текстовой записи. При этом в исправном (незараженном вирусом) файле запись ограничивается следующими данными: 127.0.0.1.localhost.
- Если вы обнаружили, что помимо указанного текста в файле имеются и другие записи, то это не что иное, как мусор, оставленный хитроумным вирусом. Именно он не дает программам на сайте «ВКонтакте» нормально работать, блокируя доступ к ним.
- Нам нужно избавиться от лишних записей. Полностью очищаем документ (в целях лучшей безопасности), а нужное сообщение вводим заново. Сохраняем изменения и закрываем редактор.
- Теперь нужно перезагрузить компьютер, после чего ошибка должна исчезнуть. Попробуйте зайти на свою страничку в соцсети и прослушать аудиофайлы, а также открыть видео. Ошибка JavaScript Error «ВКонтакте» больше не появляется.
Этот способ самый надежный, но в то же время достаточно простой. Как правило, он помогает решить проблемы, связанные с ошибками JavaScript. Чтобы не допустить подобных неприятностей, проверьте работу своего антивируса. При необходимости обновите его или установите новый, ведь надежная защита компьютера — основа бесперебойной работы, в том числе и при пользовании сайтами во всемирной сети.